Note
Go to the end to download the full example code.
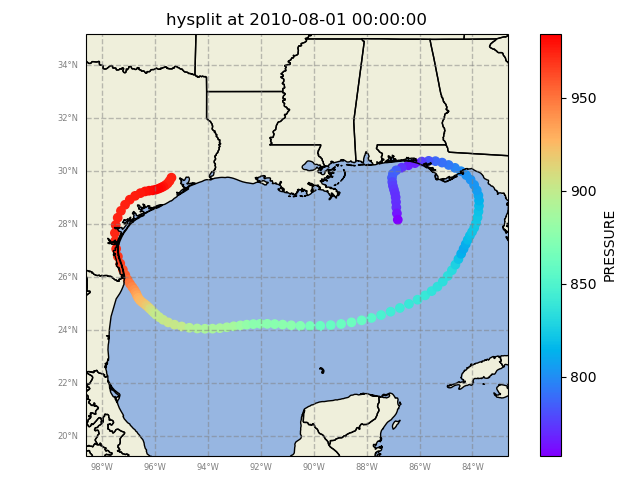
Read and plot a HYSPLIT trajectory file from a HYSPlIT run.#
This example shows how to read and plot a backtrajectory calculated by the NOAA HYSPLIT model over Houston.
Author: Robert Jackson
import matplotlib.pyplot as plt
from arm_test_data import DATASETS

import act

# Load the data
filename = DATASETS.fetch('houstonaug300.0summer2010080100')
ds = act.io.read_hysplit(filename)

# Use the GeographicPlotDisplay object to make the plot
disp = act.plotting.GeographicPlotDisplay(ds)
disp.geoplot('PRESSURE', cartopy_feature=['STATES', 'OCEAN', 'LAND'])
plt.show()
Total running time of the script: (0 minutes 4.030 seconds)