Note
Go to the end to download the full example code.
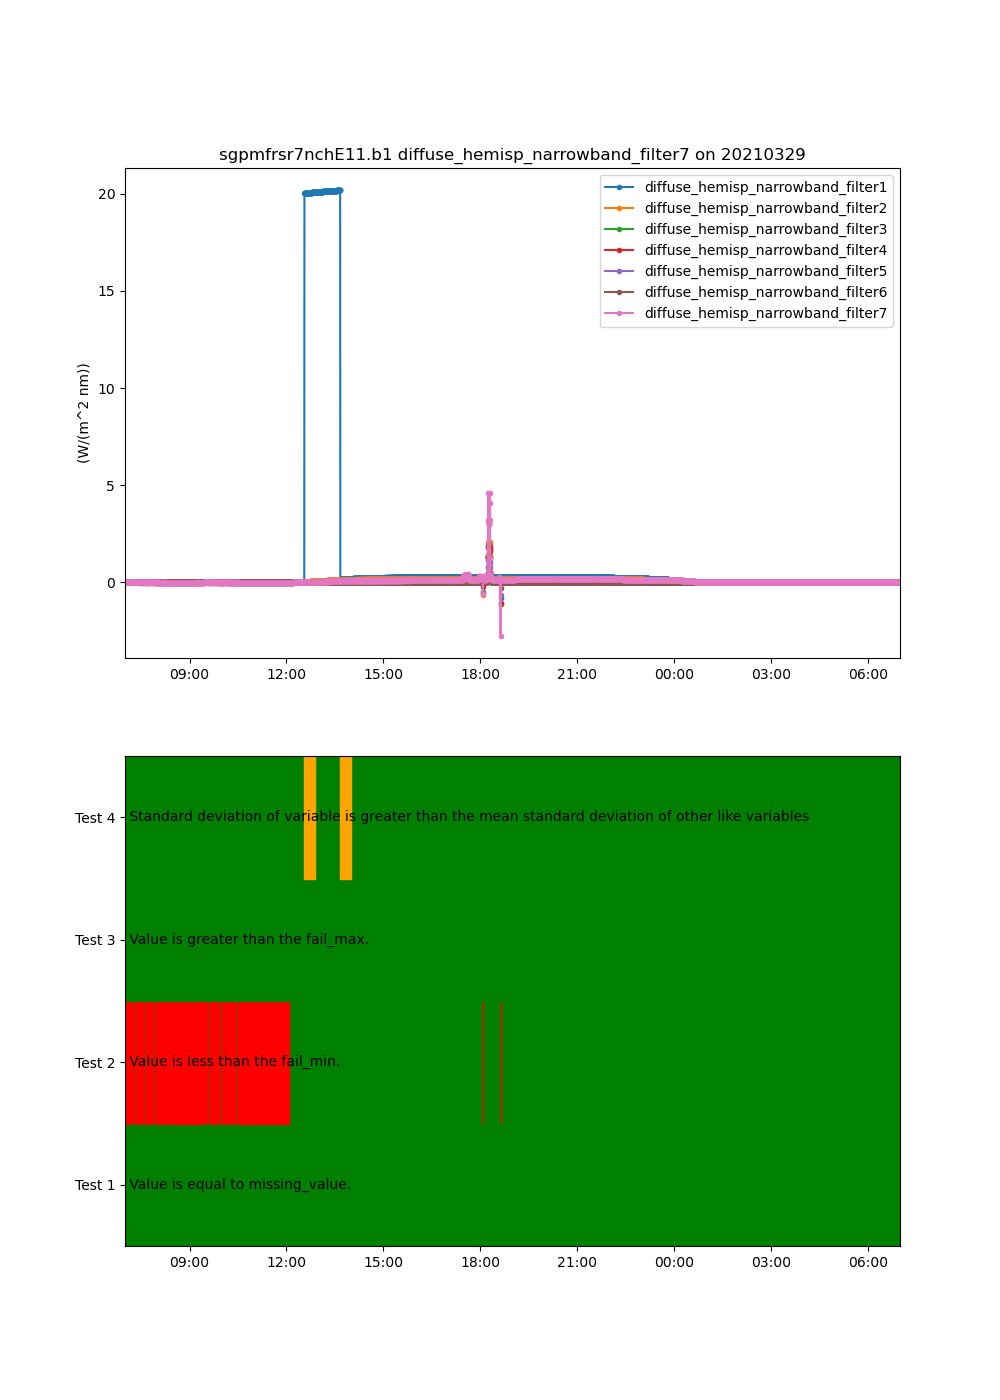
Apply the relative variability test to data#
This is a short example of how the relative variability test can be applied to a set of variables to determine if one has greater variability than the others.
This will show the variability test being tripped if the standard deviation of one variable is significantly different than that of the others.
Author: Adam Theisen
from matplotlib import pyplot as plt

import act
from act.tests import EXAMPLE_MFRSR

# Read in some sample MFRSR data
ds = act.io.read_arm_netcdf(EXAMPLE_MFRSR)
ds.clean.cleanup()
variables = [v for v in list(ds) if v.startswith('diffuse_hemisp_narrowband_filter')]

# Modify data to trip the test
data = ds[variables[0]].values
data[1000:1200] += 20
ds[variables[0]].values = data

# Apply the test and have threshold of 1
thresh = 1.0
result = ds.qcfilter.add_relative_variability_test(variables, thresh)

# Plot up the variables and the qc test for the first filter
display = act.plotting.TimeSeriesDisplay(ds, figsize=(10, 14), subplot_shape=(2,))
for v in variables:
    display.plot(v, label=v, subplot_index=(0,))

display.qc_flag_block_plot(variables[0], subplot_index=(1,))
plt.show()
Total running time of the script: (0 minutes 1.507 seconds)