Note
Go to the end to download the full example code.
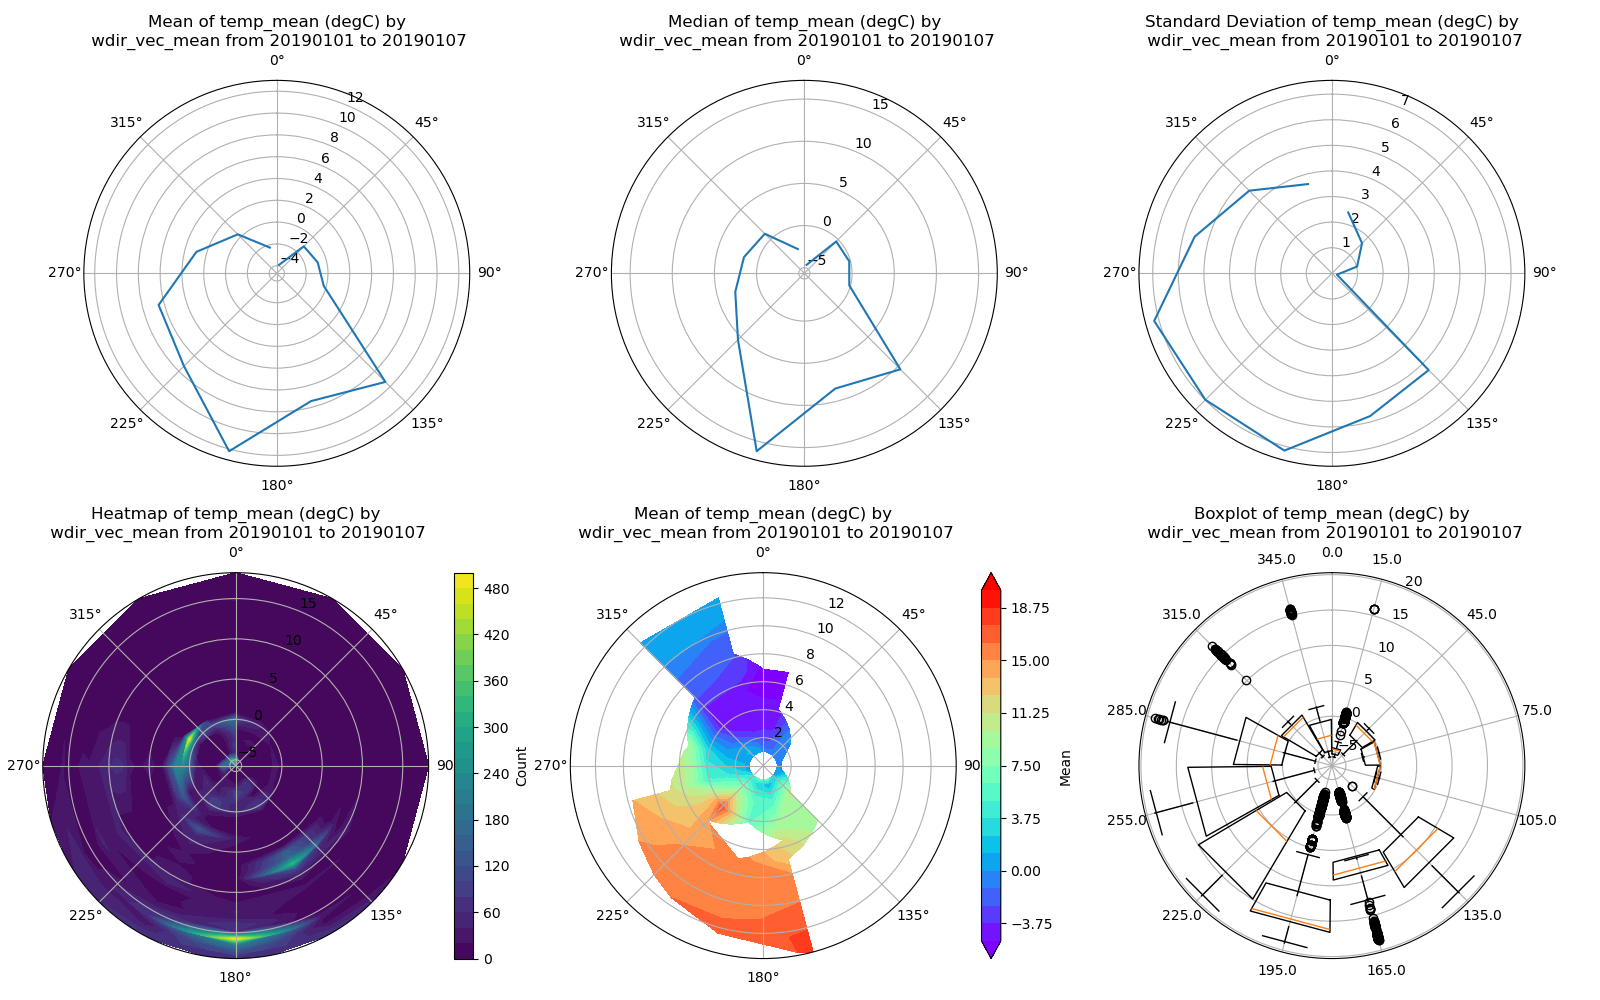
Data rose plot#
This is an example of how to display a data rose. As can be seen in the final plot, there are two major bullseyes of data, one around 0ºC to the Northeast and another around 15ºC to the South. This tells us that we get lower temperatures when winds are out of the N/NE as would be expected at this location. This can be extended to easily review other types of data as well like aerosols and fluxes.
from arm_test_data import DATASETS
from matplotlib import pyplot as plt

import act

# Read in some data with wind speed/direction in the file
met_wildcard_list = [
    'sgpmetE13.b1.20190101.000000.cdf',
    'sgpmetE13.b1.20190102.000000.cdf',
    'sgpmetE13.b1.20190103.000000.cdf',
    'sgpmetE13.b1.20190104.000000.cdf',
    'sgpmetE13.b1.20190105.000000.cdf',
    'sgpmetE13.b1.20190106.000000.cdf',
    'sgpmetE13.b1.20190107.000000.cdf',
]
met_filenames = [DATASETS.fetch(file) for file in met_wildcard_list]
ds = act.io.arm.read_arm_netcdf(met_filenames)

# Set up wind rose display object
display = act.plotting.WindRoseDisplay(ds, subplot_shape=(2, 3), figsize=(16, 10))

# Plot mean temperature based on wind direction
display.plot_data(
    'wdir_vec_mean',
    'wspd_vec_mean',
    'temp_mean',
    num_dirs=12,
    plot_type='line',
    subplot_index=(0, 0),
)

# Plot median temperature based on wind direction
display.plot_data(
    'wdir_vec_mean',
    'wspd_vec_mean',
    'temp_mean',
    num_dirs=12,
    plot_type='line',
    subplot_index=(0, 1),
    line_plot_calc='median',
)

# Plot standard deviation of temperature based on wind direction
display.plot_data(
    'wdir_vec_mean',
    'wspd_vec_mean',
    'temp_mean',
    num_dirs=12,
    plot_type='line',
    subplot_index=(0, 2),
    line_plot_calc='stdev',
)

# Plot a contour of counts of temperature based on wind direction
display.plot_data(
    'wdir_vec_mean',
    'wspd_vec_mean',
    'temp_mean',
    num_dirs=12,
    plot_type='contour',
    subplot_index=(1, 0),
)

# Plot a contour of mean temperature based on wind direction and wind speed
display.plot_data(
    'wdir_vec_mean',
    'wspd_vec_mean',
    'temp_mean',
    num_dirs=12,
    plot_type='contour',
    contour_type='mean',
    num_data_bins=10,
    clevels=21,
    cmap='rainbow',
    vmin=-5,
    vmax=20,
    subplot_index=(1, 1),
)

# Plot a boxplot of temperature based on wind direction
display.plot_data(
    'wdir_vec_mean',
    'wspd_vec_mean',
    'temp_mean',
    num_dirs=12,
    plot_type='boxplot',
    subplot_index=(1, 2),
)

plt.show()
Total running time of the script: (0 minutes 2.123 seconds)