Note
Go to the end to download the full example code.
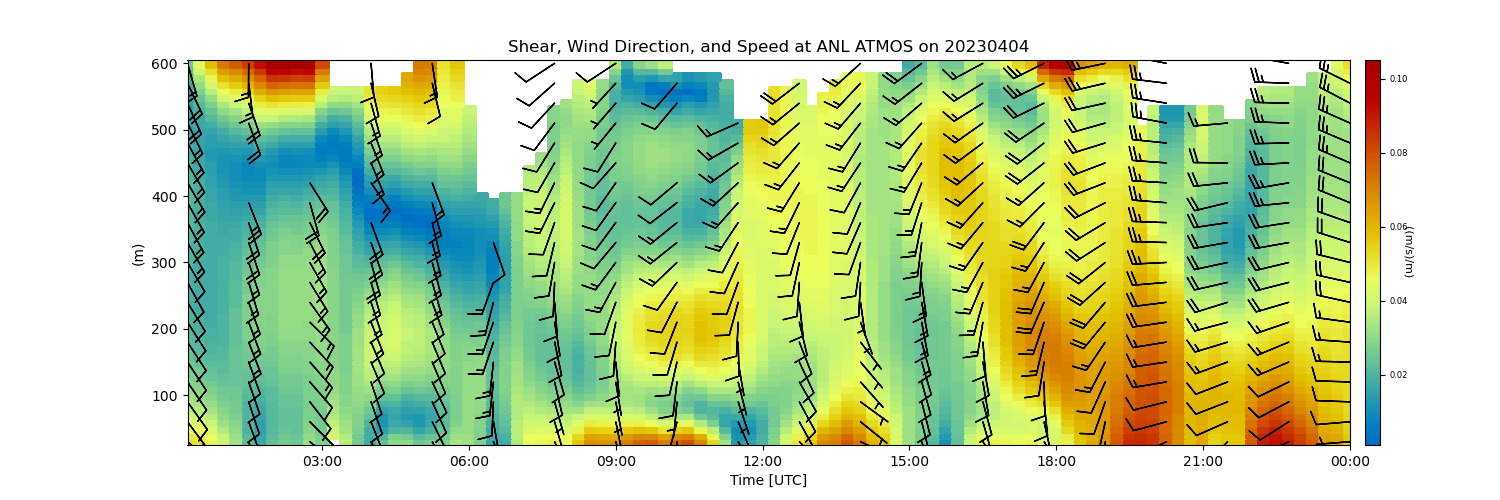
Read and plot a Sodar file#
This example shows how to read and display Sodar data from the Argonne National Laboratory (ANL) ATMOS site.
Author: Zachary Sherman
import matplotlib.pyplot as plt
from arm_test_data import DATASETS

import act

# Call the read_sodar function.
# Example file is a MFAS Sodar at the ATMOS site. More information
# on the sodar can be found here:
# https://www.scintec.com/products/flat-array-sodar-mfas/
filename_sodar = DATASETS.fetch('sodar.20230404.mnd')
ds = act.io.read_mfas_sodar(filename_sodar)

# Create an ACT TimeSeriesDisplay.
display = act.plotting.TimeSeriesDisplay(
    {'Shear, Wind Direction, and Speed at ANL ATMOS': ds}, subplot_shape=(1,), figsize=(15, 5)
)

# Plot shear with a wind barb overlay, while using a color vision
# deficiency (CVD) colormap.
display.plot('shear', subplot_index=(0,), cvd_friendly=True)
display.plot_barbs_from_spd_dir('speed', 'dir')
plt.show()
Total running time of the script: (0 minutes 0.420 seconds)