Note
Go to the end to download the full example code.
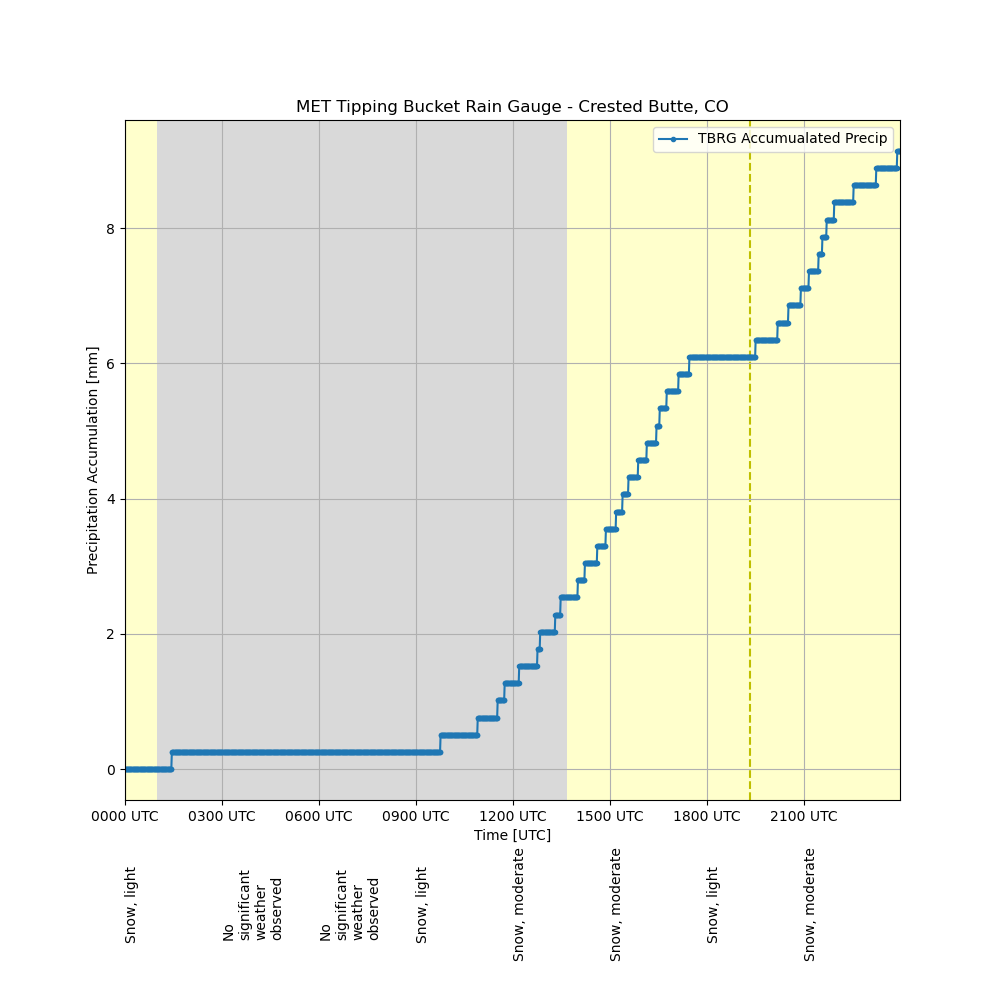
Plot Present Weather Code#
Plot the Present Weather Code on Precipitation Accumulation
Author: Joe O’Brien
import matplotlib.pyplot as plt
from arm_test_data import DATASETS
from matplotlib.dates import DateFormatter, num2date

import act

# Read the MET data into an xarray dataset
filename_met = DATASETS.fetch('gucmetM1.b1.20230301.000000.cdf')
ds = act.io.read_arm_netcdf(filename_met)

# Decode the Present Weather Codes
# Pass it to the function to decode it along with the variable name
ds = act.utils.inst_utils.decode_present_weather(ds, variable='pwd_pw_code_inst')

# Calculate Precipitation Accumulation
pre_accum = act.utils.accumulate_precip(
    ds.where(ds.qc_tbrg_precip_total == 0), "tbrg_precip_total"
).tbrg_precip_total_accumulated.compute()

# Add the Precipitation Accum to the MET DataSet
ds['tbrg_accum'] = pre_accum

# Create a matplotlib figure
fig, ax = plt.subplots(1, 1, figsize=(10, 10))
# Adjust subplot width
fig.subplots_adjust(hspace=0.09)

# Create ACT display
display = act.plotting.TimeSeriesDisplay(ds)

# Define the Date/Time Format
date_form = DateFormatter("%H%M UTC")

# Assign the ACT display object to the matplotlib figure subplot
display.assign_to_figure_axis(fig, ax)
# Datastream Names are needed for plotting!
display.plot('tbrg_accum', label='TBRG Accumualated Precip')

# Add a day/night background
display.day_night_background()

# Update axe information and formatting!
ax.set_ylabel('Precipitation Accumulation [mm]')
# Add a title
ax.set_title('MET Tipping Bucket Rain Gauge - Crested Butte, CO')
# Define the x-axis format
ax.xaxis.set_major_formatter(date_form)
# Define the x-axis label
ax.set_xlabel('Time [UTC]')
# Gridlines are helpful
ax.grid(True)

# Grab the X-ticks (and convert to datetime objects) to plot location of PWD codes
xticks = display.axes[0].get_xticks()
ndates = [num2date(x) for x in xticks]

# Grab the PWD codes associated with those ticks
ncode = [
    ds['pwd_pw_code_inst_decoded'].sel(time=x.replace(tzinfo=None), method='nearest').data.tolist()
    for x in ndates
]
pwd_code = ['\n'.join(x.split(' ')) if len(x) > 20 else x for x in ncode]

# Display these select PWD codes as vertical texts along the x-axis
# Define the minimum y-axis tick mark for plotting
ymin = display.axes[0].get_yticks()[0]

# Plot the PWD code
for i, key in enumerate(xticks):
    ax.text(key, ymin, pwd_code[i], rotation=90, va='center')

plt.subplots_adjust(bottom=0.20)

plt.show()
Total running time of the script: (0 minutes 0.248 seconds)