Note
Go to the end to download the full example code.
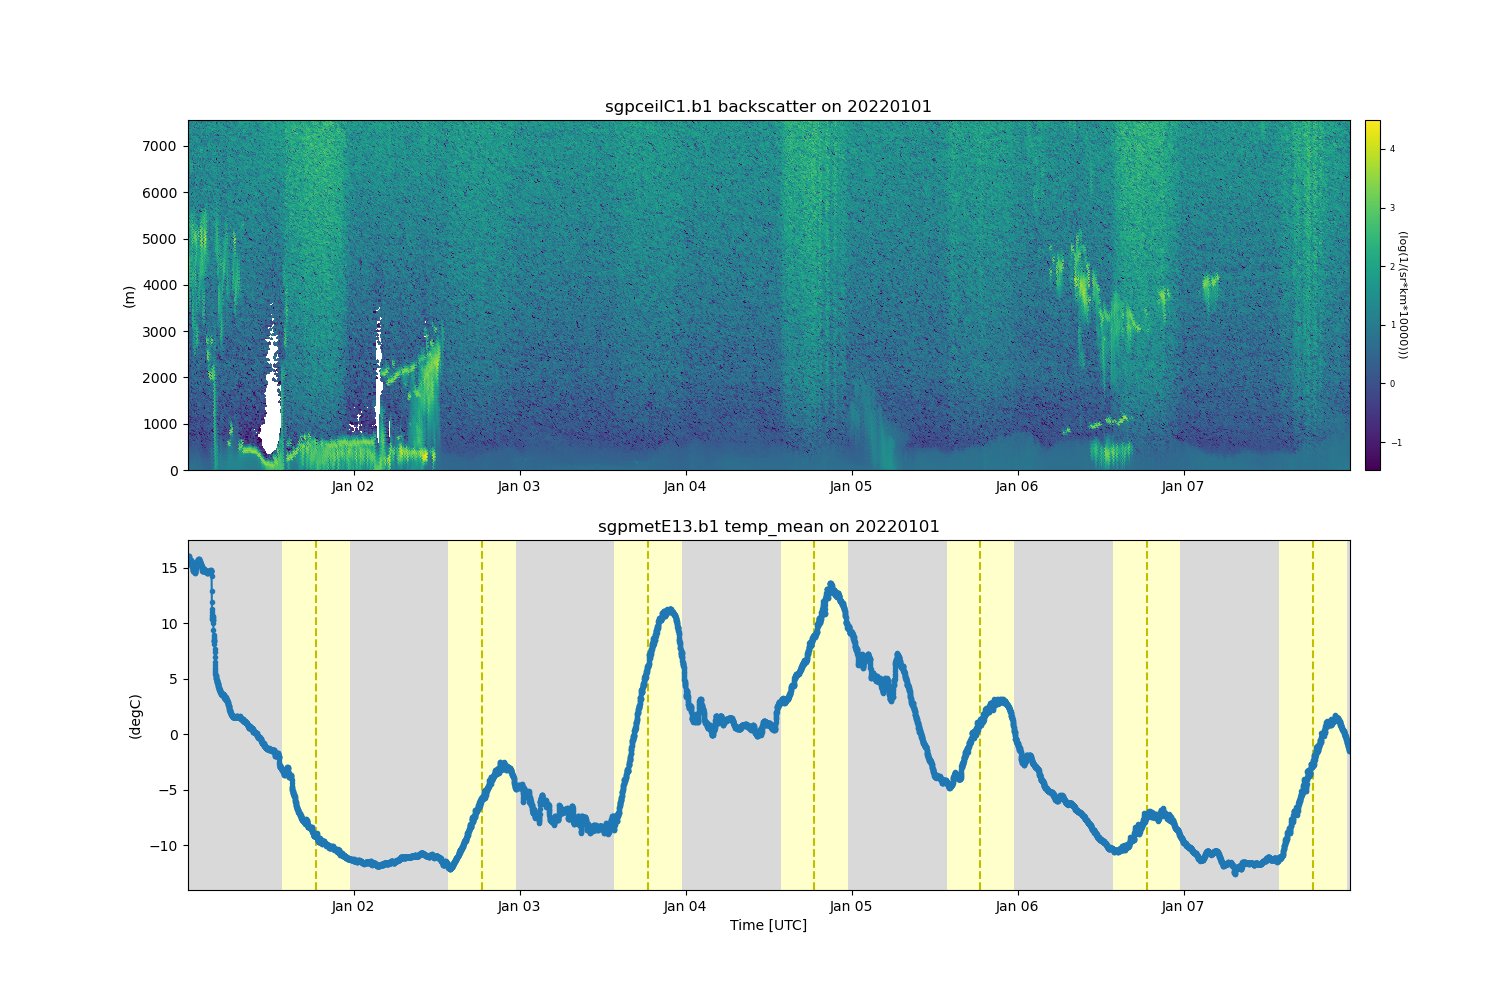
Plot multiple datasets#
This is an example of how to download and plot multiple datasets at a time.

[DOWNLOADING] sgpceilC1.b1.20220101.000014.nc
[DOWNLOADING] sgpceilC1.b1.20220102.000011.nc
[DOWNLOADING] sgpceilC1.b1.20220103.000009.nc
[DOWNLOADING] sgpceilC1.b1.20220104.000008.nc
[DOWNLOADING] sgpceilC1.b1.20220105.000006.nc
[DOWNLOADING] sgpceilC1.b1.20220106.000003.nc
[DOWNLOADING] sgpceilC1.b1.20220107.000000.nc

If you use these data to prepare a publication, please cite:

Zhang, D., Ermold, B., & Morris, V. Ceilometer (CEIL), 2022-01-01 to 2022-01-07,
Southern Great Plains (SGP), Central Facility, Lamont, OK (C1). Atmospheric
Radiation Measurement (ARM) User Facility. https://doi.org/10.5439/1181954

[DOWNLOADING] sgpmetE13.b1.20220101.000000.cdf
[DOWNLOADING] sgpmetE13.b1.20220102.000000.cdf
[DOWNLOADING] sgpmetE13.b1.20220103.000000.cdf
[DOWNLOADING] sgpmetE13.b1.20220104.000000.cdf
[DOWNLOADING] sgpmetE13.b1.20220105.000000.cdf
[DOWNLOADING] sgpmetE13.b1.20220106.000000.cdf
[DOWNLOADING] sgpmetE13.b1.20220107.000000.cdf

If you use these data to prepare a publication, please cite:

Kyrouac, J., Shi, Y., & Tuftedal, M. Surface Meteorological Instrumentation
(MET), 2022-01-01 to 2022-01-07, Southern Great Plains (SGP), Lamont, OK
(Extended and Co-located with C1) (E13). Atmospheric Radiation Measurement (ARM)
User Facility. https://doi.org/10.5439/1786358
import os

import matplotlib.pyplot as plt
from arm_test_data import DATASETS

import act

# Place your username and token here
username = os.getenv('ARM_USERNAME')
token = os.getenv('ARM_PASSWORD')

# Get data from the web service if username and token are available
# if not, use test data
if username is None or token is None or len(username) == 0 or len(token) == 0:
    filename_ceil = DATASETS.fetch('sgpceilC1.b1.20190101.000000.nc')
    ceil_ds = act.io.arm.read_arm_netcdf(filename_ceil)
    filename_met = DATASETS.fetch('sgpmetE13.b1.20190101.000000.cdf')
    met_ds = act.io.arm.read_arm_netcdf(filename_met)
else:
    # Download and read data
    results = act.discovery.download_arm_data(
        username, token, 'sgpceilC1.b1', '2022-01-01', '2022-01-07'
    )
    ceil_ds = act.io.arm.read_arm_netcdf(results)
    results = act.discovery.download_arm_data(
        username, token, 'sgpmetE13.b1', '2022-01-01', '2022-01-07'
    )
    met_ds = act.io.arm.read_arm_netcdf(results)

# Read in CEIL data and correct it
ceil_ds = act.corrections.ceil.correct_ceil(ceil_ds, -9999.0)


# You can use tuples if the datasets in the tuple contain a
# datastream attribute. This is required in all ARM datasets.
display = act.plotting.TimeSeriesDisplay((ceil_ds, met_ds), subplot_shape=(2,), figsize=(15, 10))
display.plot('backscatter', 'sgpceilC1.b1', subplot_index=(0,))
display.plot('temp_mean', 'sgpmetE13.b1', subplot_index=(1,))
display.day_night_background('sgpmetE13.b1', subplot_index=(1,))
plt.show()

# You can also use a dictionary so that you can customize
# your datastream names to something that may be more useful.
display = act.plotting.TimeSeriesDisplay(
    {'ceiliometer': ceil_ds, 'met': met_ds}, subplot_shape=(2,), figsize=(15, 10)
)
display.plot('backscatter', 'ceiliometer', subplot_index=(0,))
display.plot('temp_mean', 'met', subplot_index=(1,))
display.day_night_background('met', subplot_index=(1,))
plt.show()

ceil_ds.close()
met_ds.close()
Total running time of the script: (0 minutes 34.285 seconds)