Note
Go to the end to download the full example code.
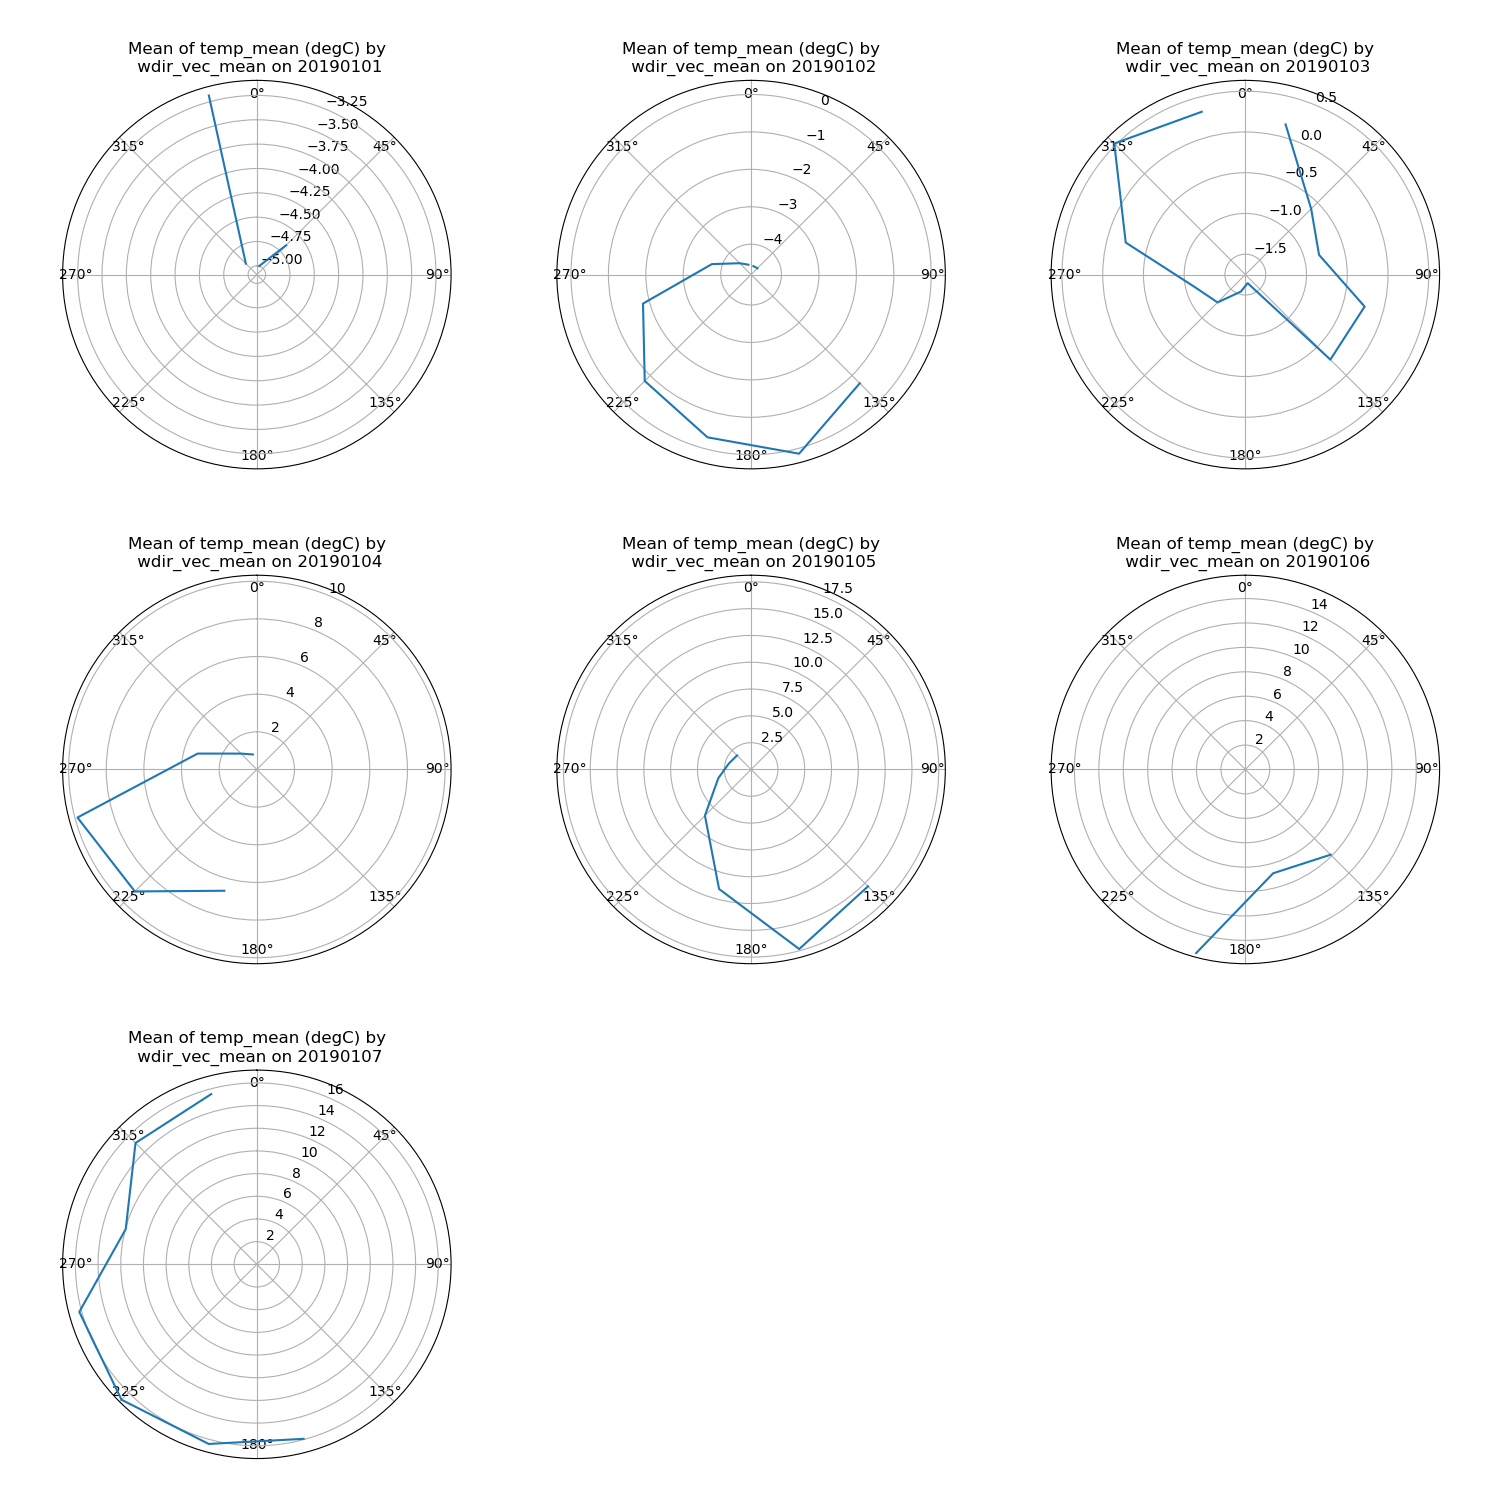
Calculate and plot wind rose plots separated by day.ΒΆ
Example of how to read in MET data and plot histograms of wind speed and temperature grouped by day.
Author: Bobby Jackson
![Mean of temp_mean (degC) by wdir_vec_mean on 20190101, Mean of temp_mean (degC) by wdir_vec_mean on 20190102, Mean of temp_mean (degC) by wdir_vec_mean on 20190103, Mean of temp_mean (degC) by wdir_vec_mean on 20190104, Mean of temp_mean (degC) by wdir_vec_mean on 20190105, Mean of temp_mean (degC) by wdir_vec_mean on 20190106, Mean of temp_mean (degC) by wdir_vec_mean on 20190107](../../../_images/sphx_glr_plot_days_001.png)
/home/runner/work/ACT/ACT/act/plotting/windrosedisplay.py:358: RuntimeWarning: Mean of empty slice
arr.append(np.nanmean(data[idx]))
/home/runner/work/ACT/ACT/act/plotting/windrosedisplay.py:358: RuntimeWarning: Mean of empty slice
arr.append(np.nanmean(data[idx]))
/home/runner/work/ACT/ACT/act/plotting/windrosedisplay.py:358: RuntimeWarning: Mean of empty slice
arr.append(np.nanmean(data[idx]))
/home/runner/work/ACT/ACT/act/plotting/windrosedisplay.py:358: RuntimeWarning: Mean of empty slice
arr.append(np.nanmean(data[idx]))
/home/runner/work/ACT/ACT/act/plotting/windrosedisplay.py:358: RuntimeWarning: Mean of empty slice
arr.append(np.nanmean(data[idx]))
/home/runner/work/ACT/ACT/act/plotting/windrosedisplay.py:358: RuntimeWarning: Mean of empty slice
arr.append(np.nanmean(data[idx]))
/home/runner/work/ACT/ACT/act/plotting/windrosedisplay.py:358: RuntimeWarning: Mean of empty slice
arr.append(np.nanmean(data[idx]))
from arm_test_data import DATASETS
import matplotlib.pyplot as plt
import act
# Read in the sample MET data
met_wildcard_list = [
'sgpmetE13.b1.20190101.000000.cdf',
'sgpmetE13.b1.20190102.000000.cdf',
'sgpmetE13.b1.20190103.000000.cdf',
'sgpmetE13.b1.20190104.000000.cdf',
'sgpmetE13.b1.20190105.000000.cdf',
'sgpmetE13.b1.20190106.000000.cdf',
'sgpmetE13.b1.20190107.000000.cdf',
]
met_filenames = [DATASETS.fetch(file) for file in met_wildcard_list]
ds = act.io.arm.read_arm_netcdf(met_filenames)
# Create Plot Display
display = act.plotting.WindRoseDisplay(ds, figsize=(15, 15), subplot_shape=(3, 3))
groupby = display.group_by('day')
groupby.plot_group(
'plot_data',
None,
dir_field='wdir_vec_mean',
spd_field='wspd_vec_mean',
data_field='temp_mean',
num_dirs=12,
plot_type='line',
)
# Set theta tick markers for each axis inside display to be inside the polar axes
for i in range(3):
for j in range(3):
display.axes[i, j].tick_params(pad=-20)
plt.show()
ds.close()
Total running time of the script: (0 minutes 3.425 seconds)