Note
Go to the end to download the full example code.
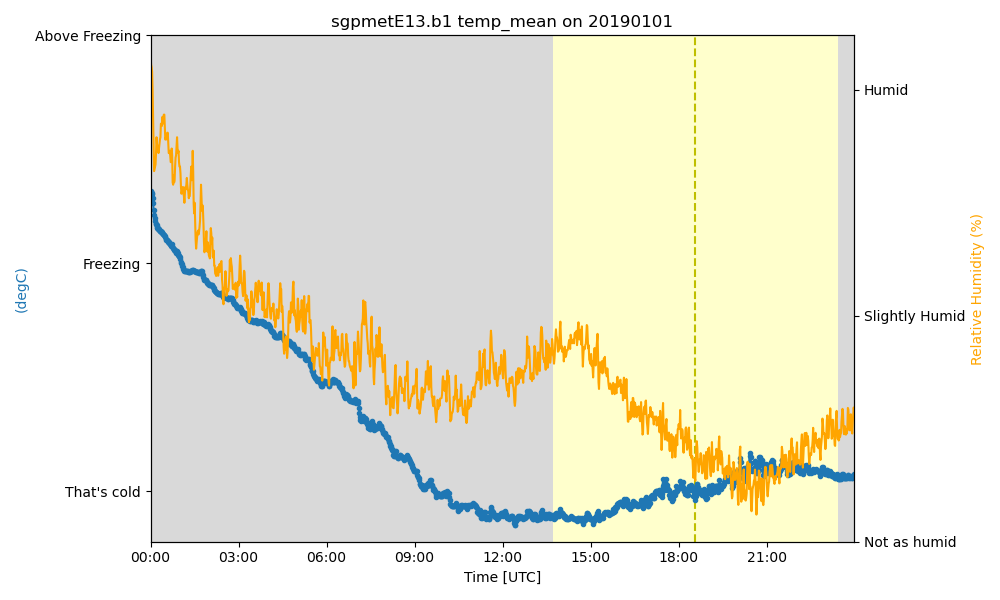
Secondary Y-Axis Plotting#
This example shows how to plot on the secondary y-axis using Matplotlib functionality. The secondary_y functionality has been removed from ACT.
import matplotlib.pyplot as plt
from arm_test_data import DATASETS

import act

# Read in the data from a MET file
filename_met = DATASETS.fetch('sgpmetE13.b1.20190101.000000.cdf')
ds = act.io.arm.read_arm_netcdf(filename_met)

# Plot temperature and relative humidity with RH on the right axis
display = act.plotting.TimeSeriesDisplay(ds, figsize=(10, 6))

# Plot the data and make the y-axes color match the lines
display.plot('temp_mean', match_line_label_color=True)
display.day_night_background()

# Get the secondary y-axes and plot the RH on it
ax2 = display.axes[0].twinx()
ax2.plot(ds['time'], ds['rh_mean'], color='orange')

# Then the axes can be updated and modified through the normal matplotlib calls.
display.axes[0].set_yticks([-5, 0, 5])
display.axes[0].set_yticklabels(["That's cold", "Freezing", "Above Freezing"])

# Secondary y-axis will use the ax2 axes
ax2.set_yticks([65, 75, 85])
ax2.set_yticklabels(['Not as humid', 'Slightly Humid', 'Humid'])
ax2.set_ylabel('Relative Humidity (%)', color='orange')

plt.tight_layout()
plt.show()
Total running time of the script: (0 minutes 0.205 seconds)