Note
Go to the end to download the full example code.
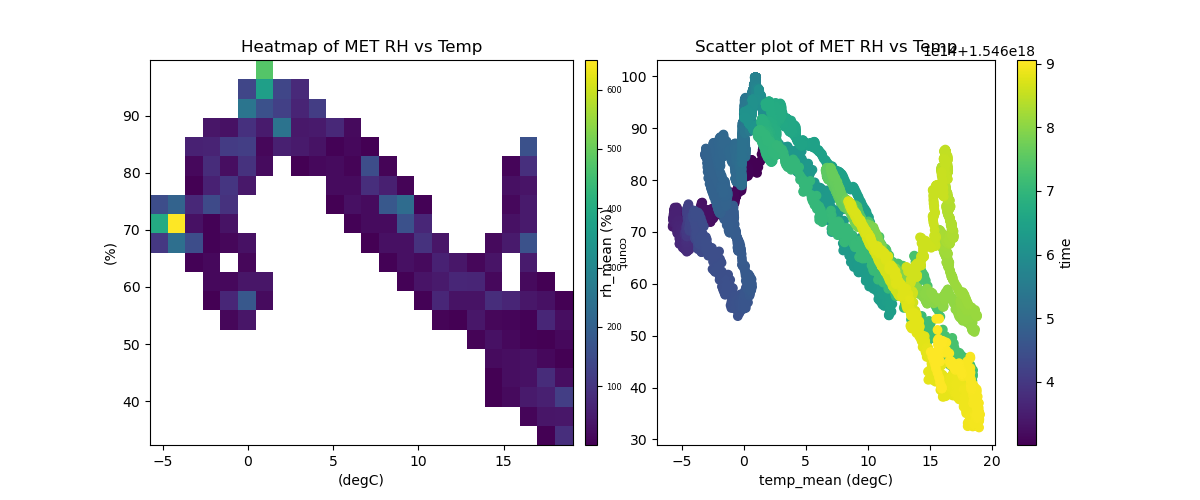
Example plot using heat maps#
Compare MET temperature and RH using a heatmap and scatter plot.
Author: Adam Theisen
import matplotlib.pyplot as plt
from arm_test_data import DATASETS

import act

# Read MET data in from the test data area
met_wildcard_list = [
    'sgpmetE13.b1.20190101.000000.cdf',
    'sgpmetE13.b1.20190102.000000.cdf',
    'sgpmetE13.b1.20190103.000000.cdf',
    'sgpmetE13.b1.20190104.000000.cdf',
    'sgpmetE13.b1.20190105.000000.cdf',
    'sgpmetE13.b1.20190106.000000.cdf',
    'sgpmetE13.b1.20190107.000000.cdf',
]
met_filenames = [DATASETS.fetch(file) for file in met_wildcard_list]
ds = act.io.arm.read_arm_netcdf(met_filenames)

# Create a DistributionDisplay object to compare fields
display = act.plotting.DistributionDisplay(ds, subplot_shape=(1, 2), figsize=(12, 5))

# Plot a heatmap and scatter plot up of RH vs Temperature
# Set the number of bins for the x-axis to 25 and y to 20
title = 'Heatmap of MET RH vs Temp'
display.plot_heatmap(
    'temp_mean', 'rh_mean', x_bins=25, y_bins=20, threshold=0, subplot_index=(0, 0), set_title=title
)

# Plot the scatter plot and shade by wind_speed
title = 'Scatter plot of MET RH vs Temp'
display.plot_scatter('temp_mean', 'rh_mean', subplot_index=(0, 1), set_title=title, m_field='time')

plt.show()
Total running time of the script: (0 minutes 0.645 seconds)