ACT Example Gallery#
This gallery houses examples on different use cases for act including downloading data from web APIs, visualization various types of data, and more. If there are specific use cases you would like to see examples of, please head on over to the ACT discussion page on GitHub.
If your looking to contribute, the templates directory found here provides templates for the examples gallery python files. For a template for creating Jupyter notebooks for ACT tutorials, blog posts and more, that template can be found here
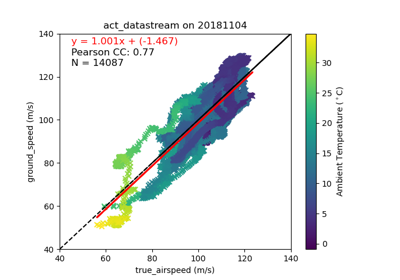
Correction examples#
Examples showing different meteorology corrections.

Discovery examples#
Examples showing different ways to discover data.

Input/Output Examples#
Examples showing different ways to read and save data.
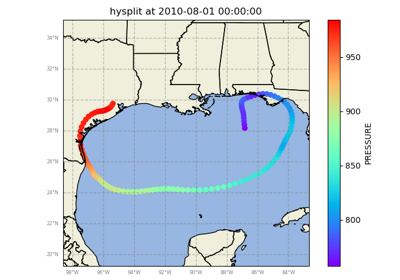
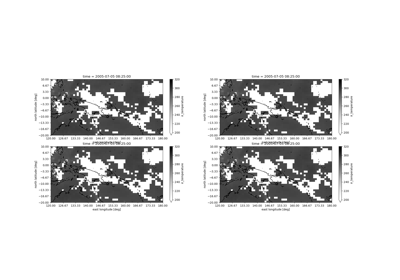
Read and plot a HYSPLIT trajectory file from a HYSPlIT run.
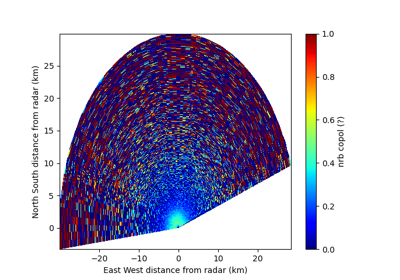
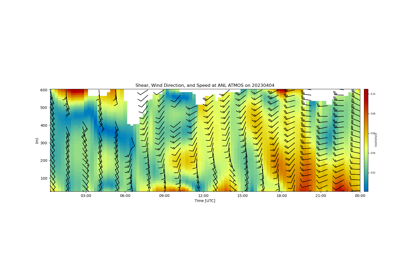

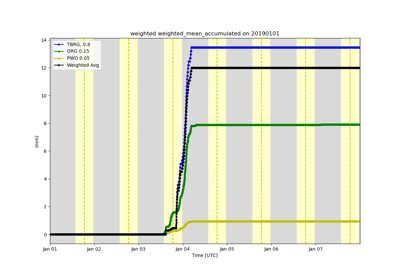
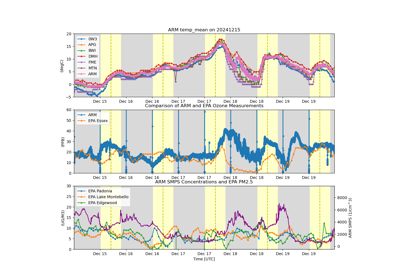
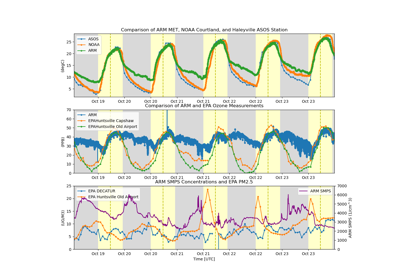
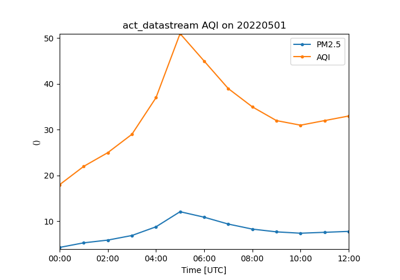
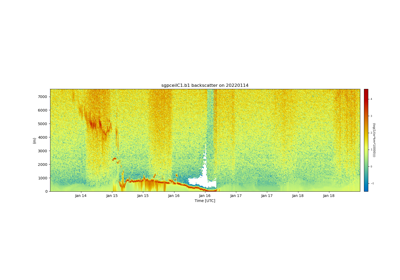
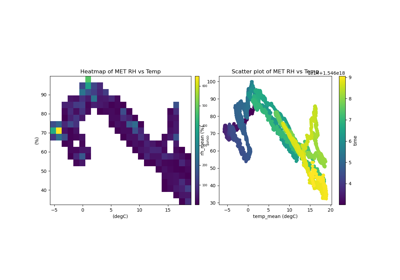
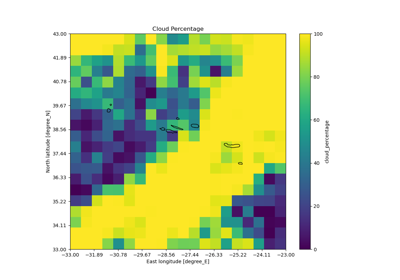
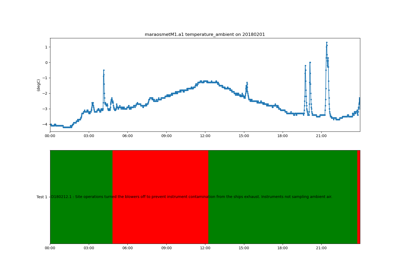
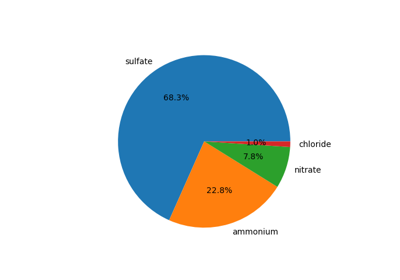
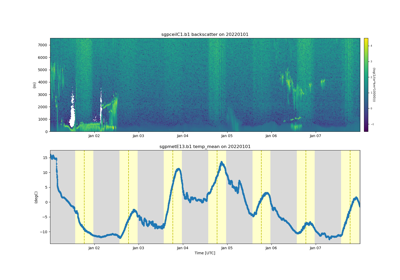
Plotting examples#
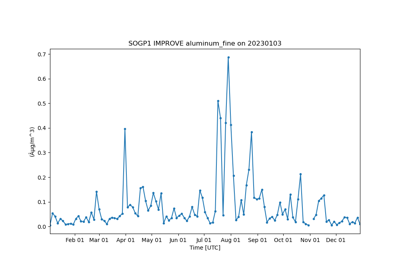
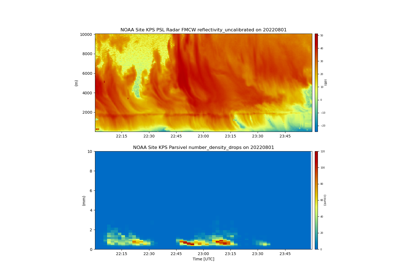
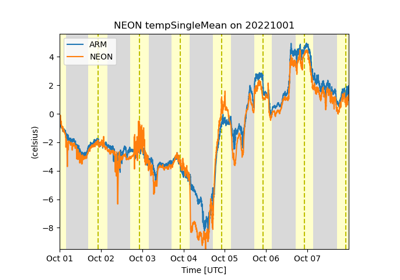
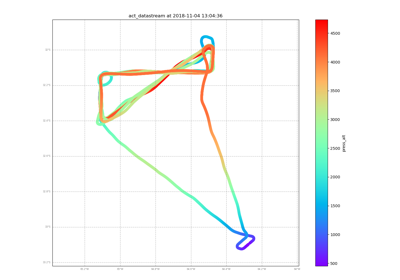
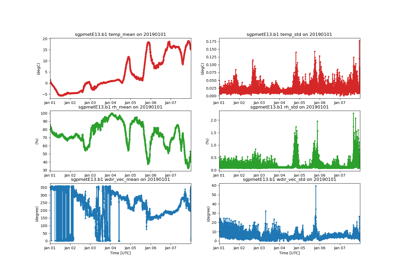
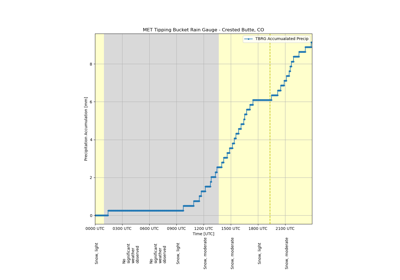
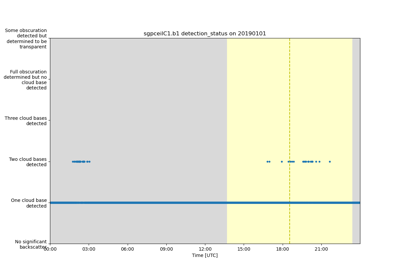
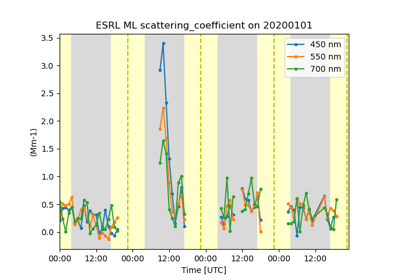
Examples showing different ways to visualize your data.
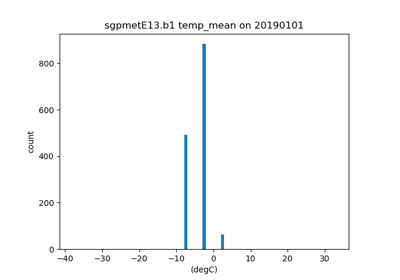
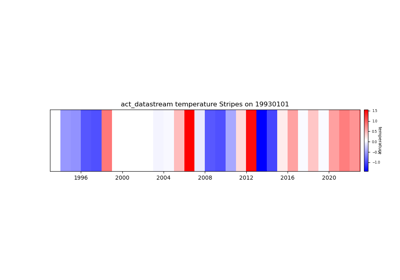
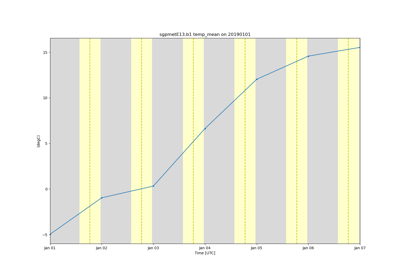
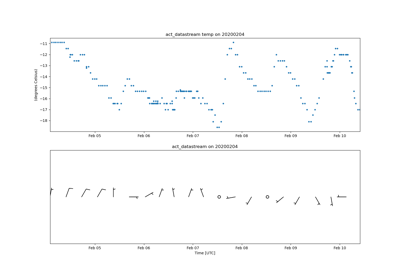
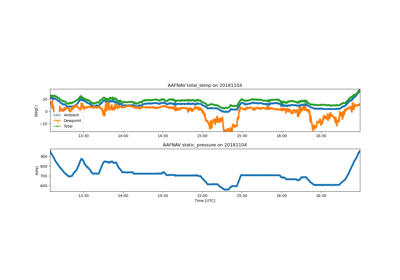
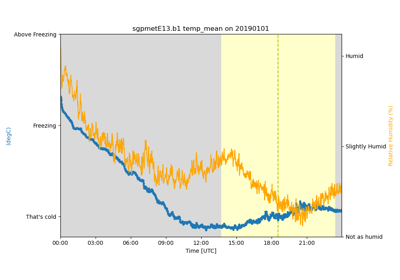
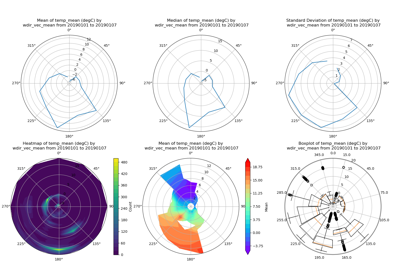
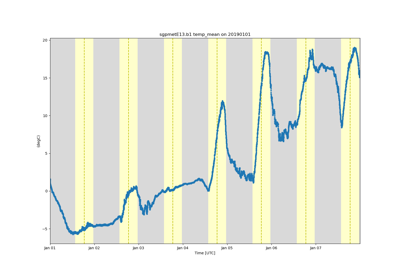
Calculate and plot daily daytime temperature averages
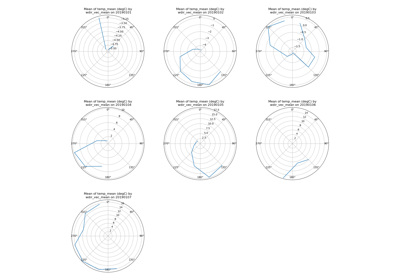
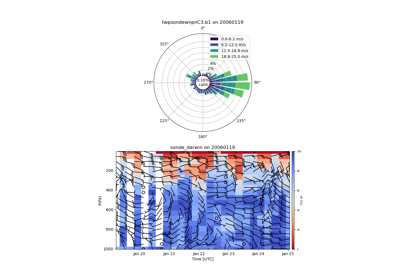
Calculate and plot wind rose plots separated by day.
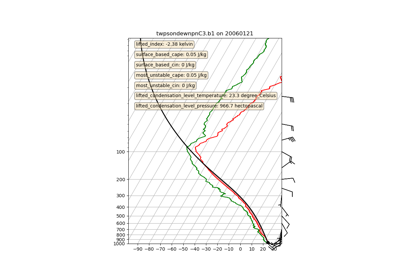
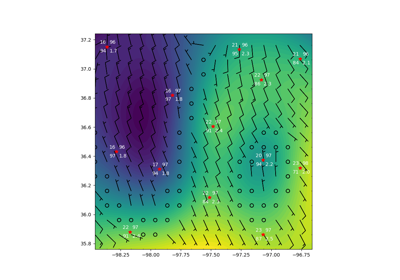
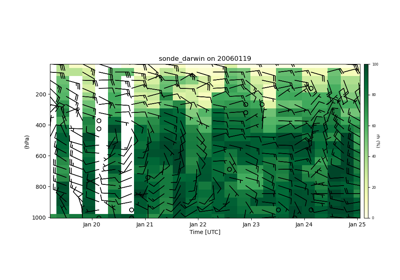
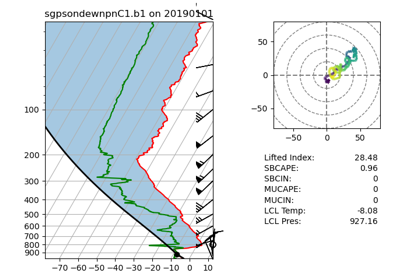
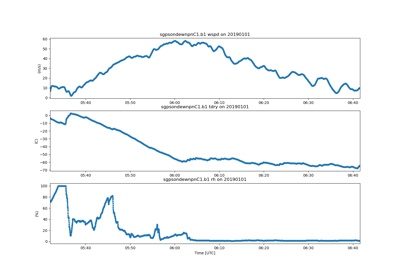
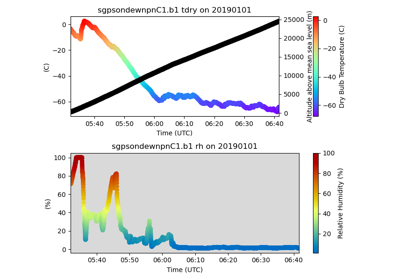
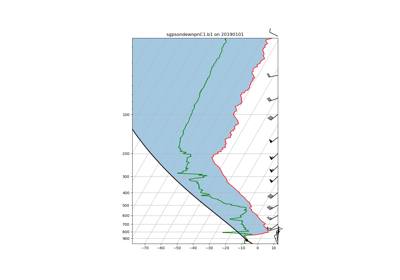
Plot winds and relative humidity from sounding data
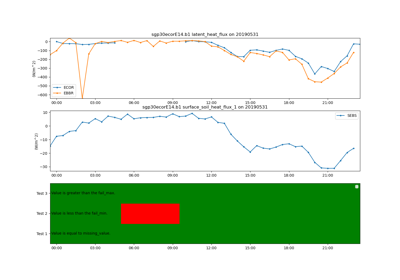
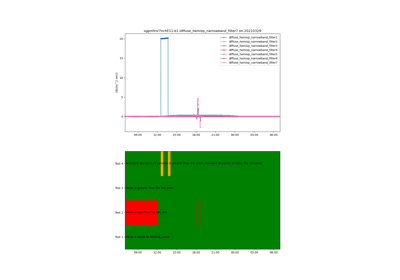
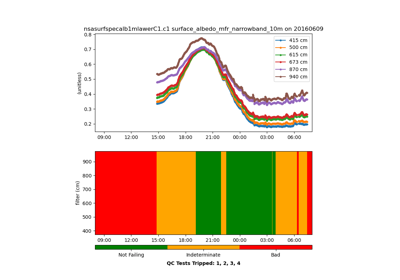
Quality Control Examples#
Examples showing different ways to apply quality control to your data.

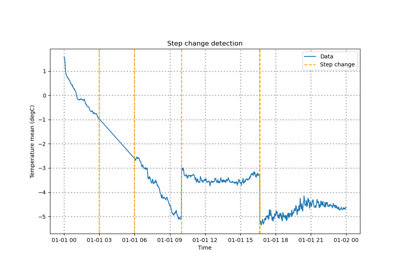
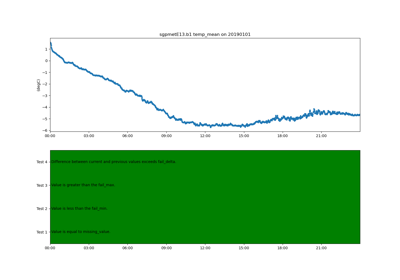
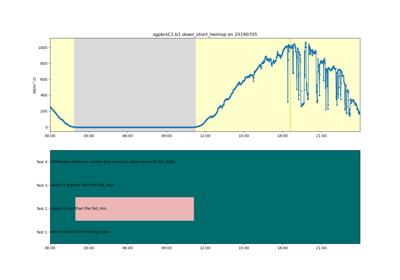
Plotting flagged data gaps with a step change test
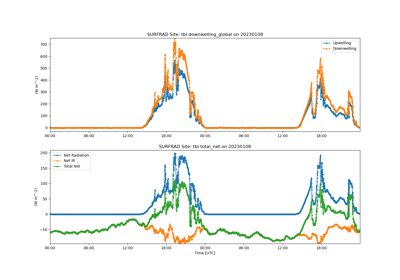
Plotting Baseline Surface Radiation Network (BSRN) QC Flags

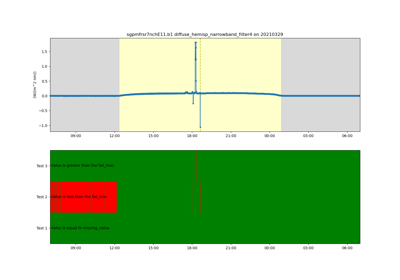
Working with and expanding embedded quality control variables
Retrieval examples#
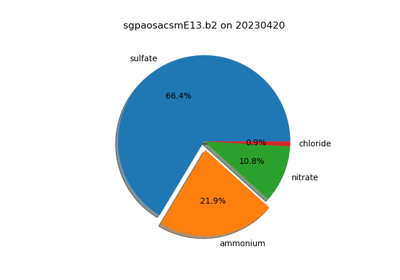
Examples showing different ways to retrieve fields from data.

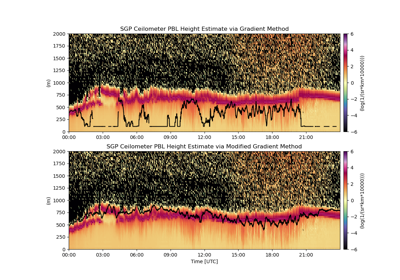
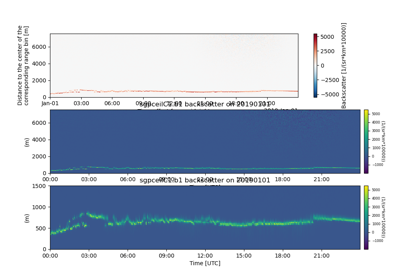
Planetary Boundary Layer Height Gradient Method Retrievals
Utility examples#
Examples showing different helpful utilies in ACT.


Workflow examples#
Examples showing full workflows, including reading, applying corrections, and visualizations.
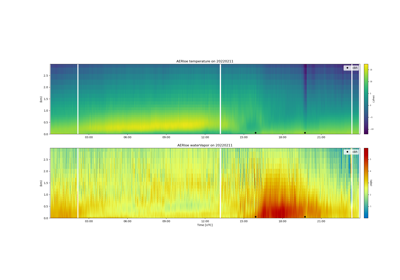
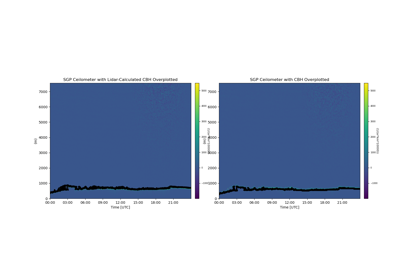
Plot AERIoe data with cloud base height from ceilometer