Note
Go to the end to download the full example code.
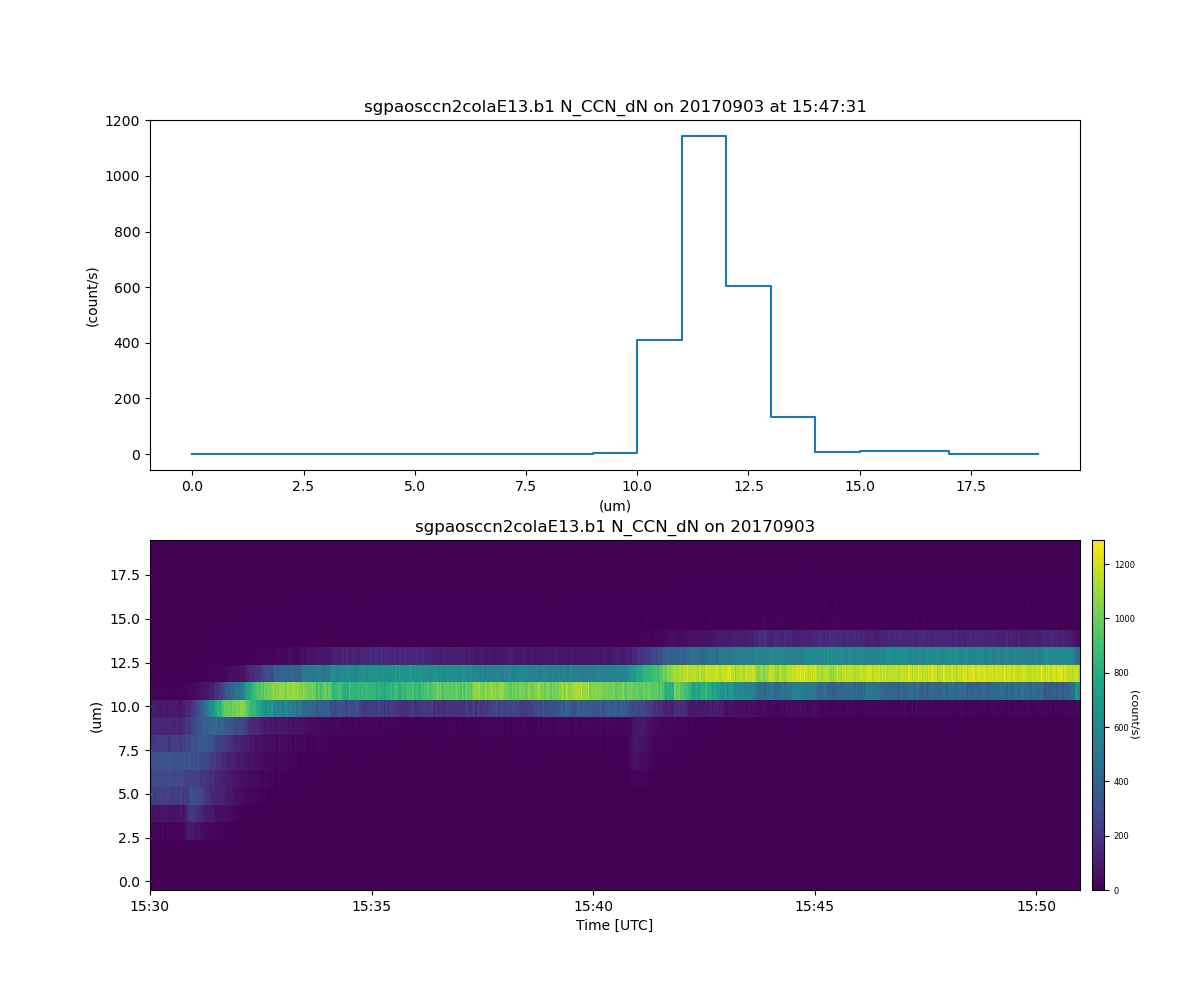
Example Size Distribution Plots#
Example shows how to plot up CCN droplet count in a size distribution plot. Also shows how to add different plot types together using assign_to_figure_axis.
Author: Adam Theisen
import matplotlib.pyplot as plt
import numpy as np
from arm_test_data import DATASETS

import act

# Read CCN data in from the test data area
filename_ccn = DATASETS.fetch('sgpaosccn2colaE13.b1.20170903.000000.nc')
ds = act.io.arm.read_arm_netcdf(filename_ccn)

# Create a DistributionDisplay object
display = act.plotting.DistributionDisplay(ds, subplot_shape=(2,), figsize=(12, 10))

# Create a size distribution plot while plotting the
# size distribution in the second plot
t_ind = np.datetime64('2017-09-03T15:47:31')
display.plot_size_distribution('N_CCN_dN', 'droplet_size', time=t_ind, subplot_index=(0,))

# This part shows how you can use different display types in a single plot
# by assigning the new display object to a figure and axes from the first one.
display2 = act.plotting.TimeSeriesDisplay(ds)
display2.assign_to_figure_axis(display.fig, display.axes[1])
display2.plot('N_CCN_dN')

plt.show()
Total running time of the script: (0 minutes 0.238 seconds)