Note
Go to the end to download the full example code.
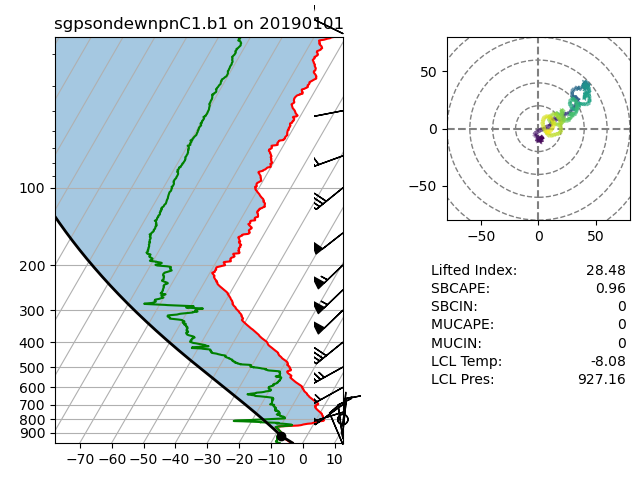
Enhanced plot of a sounding#
This example shows how to make an enhance plot for sounding data which includes a Skew-T plot, hodograph, and stability indicies.
Author: Adam Theisen
from arm_test_data import DATASETS
from matplotlib import pyplot as plt

import act

# Read data
filename_sonde = DATASETS.fetch('sgpsondewnpnC1.b1.20190101.053200.cdf')
ds = act.io.arm.read_arm_netcdf(filename_sonde)

# Plot enhanced Skew-T plot
display = act.plotting.SkewTDisplay(ds)
display.plot_enhanced_skewt(color_field='alt')

ds.close()
plt.show()
Total running time of the script: (0 minutes 0.467 seconds)