Note
Go to the end to download the full example code.
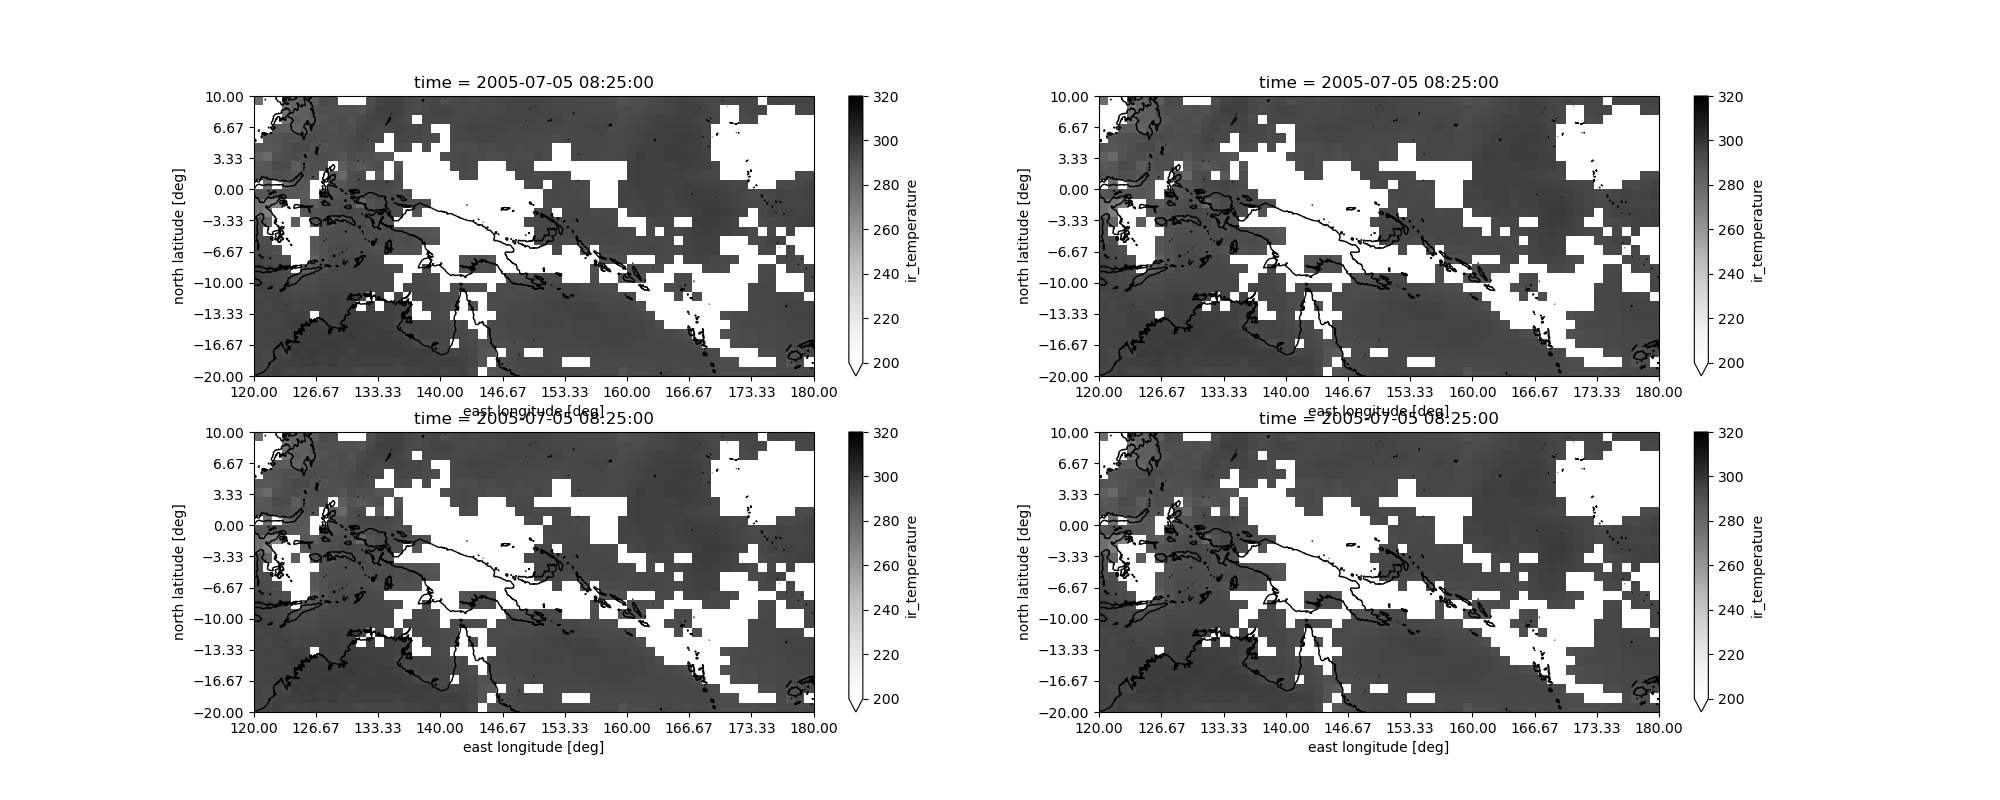
Multidimensional cross sections#
In this example, the VISST data are used to plot up cross-sectional slices through the multi-dimensional dataset
import matplotlib.pyplot as plt
from arm_test_data import DATASETS

import act

filename_visst = DATASETS.fetch('twpvisstgridirtemp.c1.20050705.002500.nc')
my_ds = act.io.arm.read_arm_netcdf(filename_visst)

# Cross section display requires that the variable being plotted be reduced to two
# Dimensions whose coordinates can be specified by variables in the file
display = act.plotting.XSectionDisplay(my_ds, figsize=(20, 8), subplot_shape=(2, 2))
display.plot_xsection_map(
    'ir_temperature',
    None,
    x='longitude',
    y='latitude',
    cmap='Greys',
    vmin=200,
    vmax=320,
    subplot_index=(0, 0),
)
display.plot_xsection_map(
    'ir_temperature',
    None,
    x='longitude',
    y='latitude',
    cmap='Greys',
    vmin=200,
    vmax=320,
    subplot_index=(1, 0),
)
display.plot_xsection_map(
    'ir_temperature',
    None,
    x='longitude',
    y='latitude',
    cmap='Greys',
    vmin=200,
    vmax=320,
    subplot_index=(0, 1),
)
display.plot_xsection_map(
    'ir_temperature',
    None,
    x='longitude',
    y='latitude',
    cmap='Greys',
    vmin=200,
    vmax=320,
    subplot_index=(1, 1),
)

plt.show()
my_ds.close()
Total running time of the script: (0 minutes 1.426 seconds)