Note
Go to the end to download the full example code.
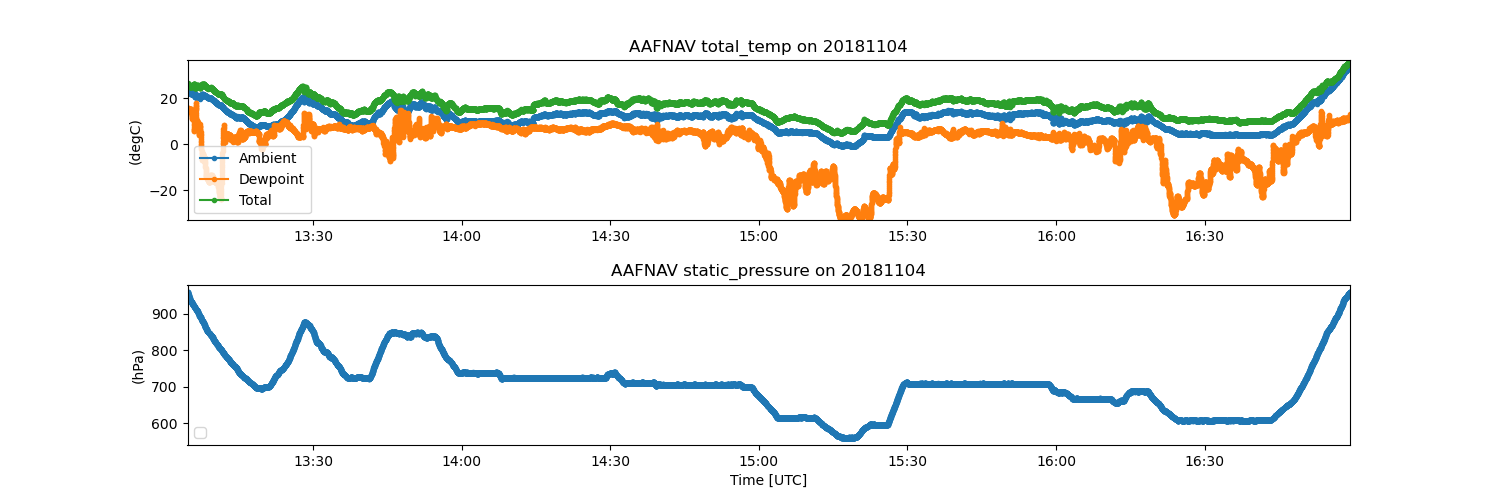
Plot ICARTT Formatted Files#
This example shows how to read and display International Consortium for Atmospheric Research on Transport and Transformation (ICARTT) file format standards V2.0
Author: Joe O’Brien
import matplotlib.pyplot as plt
from arm_test_data import DATASETS

import act
from act.io.icartt import read_icartt

# Call the read_icartt function, which supports input
# for ICARTT (v2.0) formatted files.
# Example file is ARM Aerial Facility Navigation Data
filename_icartt = DATASETS.fetch('AAFNAV_COR_20181104_R0.ict')
ds = read_icartt(filename_icartt)

# Create an ACT TimeSeriesDisplay.
display = act.plotting.TimeSeriesDisplay(
    ds, ds_name=ds.attrs['_datastream'], subplot_shape=(2,), figsize=(15, 5)
)
# Display the AAF Ambient Temperature
display.plot('ambient_temp', subplot_index=(0,), label='Ambient')
# Display the AAF Dewpoint Temperature
display.plot('dewpoint_temperature', subplot_index=(0,), label='Dewpoint')
# Display the AAF Total Temperature
# (i.e Temperature not corrected for heating due to atmospheric compression)
# Note: Total Temperature >= Ambient (Static) Temperature
display.plot('total_temp', subplot_index=(0,), label='Total')

# Display the AAF Static Air Pressure on the second subplot
display.plot('static_pressure', subplot_index=(1,))
# Include legend to identify AAF Temperatures
plt.legend(loc='lower left')
# Adjust vertical space between subplots
plt.subplots_adjust(hspace=0.4)
plt.show()
Total running time of the script: (0 minutes 1.109 seconds)