Note
Go to the end to download the full example code.
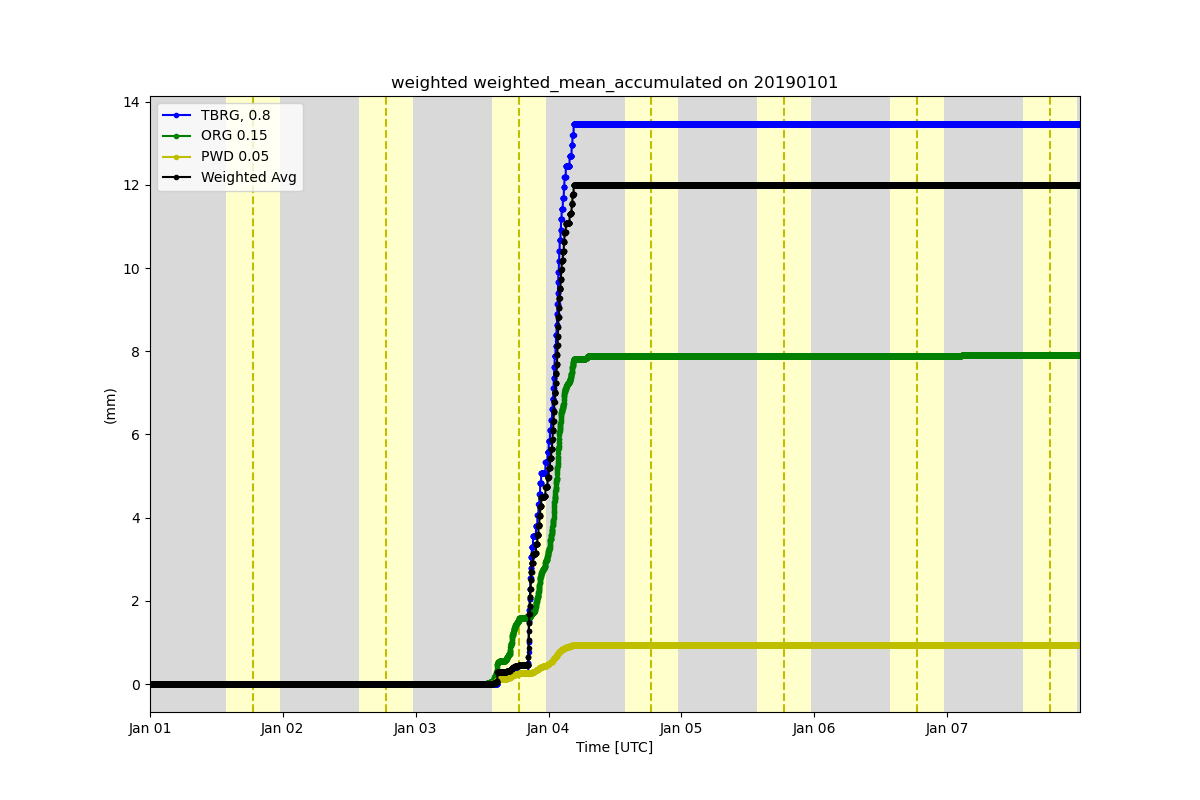
Calculate and plot weighted means#
This is an example of how to calculate a weighted average from the MET TBRG, ORG and PWD. This also calculates the accumulated precipitation and displays it
import matplotlib.pyplot as plt
import xarray as xr
from arm_test_data import DATASETS

import act

# Specify dictionary of datastreams, variables, and weights
# Note, all weights should add up to 1.
cf_ds = {
    'sgpmetE13.b1': {
        'variable': [
            'tbrg_precip_total',
            'org_precip_rate_mean',
            'pwd_precip_rate_mean_1min',
        ],
        'weight': [0.8, 0.15, 0.05],
    }
}

# Other way to define cf_ds
# cf_ds = {'sgpmetE13.b1': {'variable': ['tbrg_precip_total'], 'weight': [0.5]},
#         'sgpmetE13.b1': {'variable': ['org_precip_rate_mean'], 'weight': [0.25]},
#         'sgpmetE13.b1': {'variable': ['pwd_precip_rate_mean_1min'], 'weight': [0.25]}
#        }

# Get a list of filenames to use
met_wildcard_list = [
    'sgpmetE13.b1.20190101.000000.cdf',
    'sgpmetE13.b1.20190102.000000.cdf',
    'sgpmetE13.b1.20190103.000000.cdf',
    'sgpmetE13.b1.20190104.000000.cdf',
    'sgpmetE13.b1.20190105.000000.cdf',
    'sgpmetE13.b1.20190106.000000.cdf',
    'sgpmetE13.b1.20190107.000000.cdf',
]

ds = {}
new = {}
out_units = 'mm/hr'
for d in cf_ds:
    met_filenames = [DATASETS.fetch(file) for file in met_wildcard_list]
    ds = act.io.arm.read_arm_netcdf(met_filenames)
    # Loop through each variable and add to data list
    new_da = []
    for v in cf_ds[d]['variable']:
        da = ds[v]
        # Accumulate precip variables in new dataset
        ds = act.utils.data_utils.accumulate_precip(ds, v)

        # Convert units and add to dataarray list
        units = da.attrs['units']
        if units == 'mm':
            da.attrs['units'] = 'mm/min'
        da.values = act.utils.data_utils.convert_units(da.values, da.attrs['units'], out_units)
        da = da.resample(time='1min').mean()
        new_da.append(da)

    # Depending on number of variables for each datastream, merge or create dataset
    if len(new_da) > 1:
        new_da = xr.merge(new_da)
    else:
        new_da = new_da[0].to_dataset()

    # Add to dictionary for the weighting
    cf_ds[d]['ds'] = new_da

    # Add dataset to dictionary for plotting
    new[d] = ds

# Calculate weighted averages using the dict defined above
data = act.utils.data_utils.ts_weighted_average(cf_ds)

# Add weighted mean to plotting object and calculate accumulation
new['weighted'] = data.to_dataset(name='weighted_mean')
new['weighted']['weighted_mean'].attrs['units'] = 'mm/hr'
new['weighted'] = act.utils.data_utils.accumulate_precip(new['weighted'], 'weighted_mean')

# Plot the accumulations
display = act.plotting.TimeSeriesDisplay(new, figsize=(12, 8), subplot_shape=(1,))
display.plot('tbrg_precip_total_accumulated', dsname='sgpmetE13.b1', color='b', label='TBRG, 0.8')
display.plot(
    'org_precip_rate_mean_accumulated',
    dsname='sgpmetE13.b1',
    color='g',
    label='ORG 0.15',
)
display.plot(
    'pwd_precip_rate_mean_1min_accumulated',
    dsname='sgpmetE13.b1',
    color='y',
    label='PWD 0.05',
)
display.plot('weighted_mean_accumulated', dsname='weighted', color='k', label='Weighted Avg')
display.day_night_background('sgpmetE13.b1')
display.axes[0].legend()
plt.show()
Total running time of the script: (0 minutes 4.739 seconds)