Note
Go to the end to download the full example code.
Investigate Temperature Quantiles#
Investigate Temperature Quantiles using DistributionDisplay Violin Plots
Written: Joe O’Brien
import matplotlib.pyplot as plt
from arm_test_data import DATASETS
import act
from act.io.icartt import read_icartt
# Call the read_icartt function, which supports input
# for ICARTT (v2.0) formatted files.
# Example file is ARM Aerial Facility Navigation Data
filename_icartt = DATASETS.fetch('AAFNAV_COR_20181104_R0.ict')
ds = read_icartt(filename_icartt)
# Create a DistributionDisplay object to compare fields
display = act.plotting.DistributionDisplay(ds)
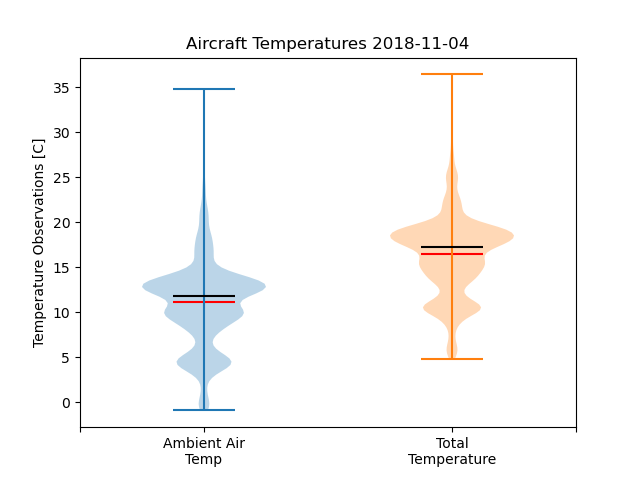
# Compare aircraft ground speed with ambient temperature
display.plot_violin(
'ambient_temp',
positions=[1.0],
)
display.plot_violin(
'total_temp',
positions=[2.0],
set_title='Aircraft Temperatures 2018-11-04',
)
# Update the tick information
display.axes[0].set_xticks([0.5, 1, 2, 2.5])
ticks = ['', 'Ambient Air\nTemp', 'Total\nTemperature', '']
display.axes[0].set_xticklabels(ticks)
# Update the y-axis label
display.axes[0].set_ylabel('Temperature Observations [C]')
plt.show()
Total running time of the script: (0 minutes 0.428 seconds)