Note
Go to the end to download the full example code.
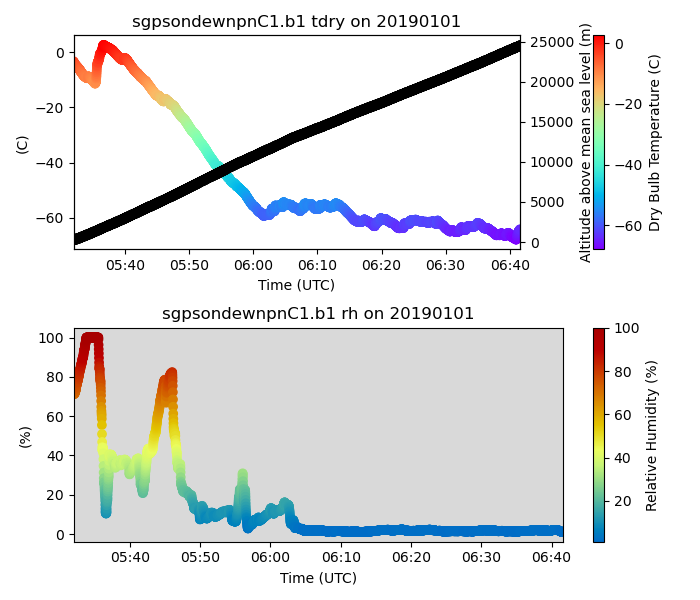
Time-Height Scatter Plot#
This will show how to use the time-height scatter plot function that’s part of the TimeSeries Display.
import matplotlib.pyplot as plt

import act
from act.tests import sample_files

# Read in radiosonde data
ds = act.io.arm.read_arm_netcdf(sample_files.EXAMPLE_SONDE1)

# Create scatter plots of the sonde data
display = act.plotting.TimeSeriesDisplay(ds, figsize=(7, 6), subplot_shape=(2,))
display.time_height_scatter('tdry', plot_alt_field=True, subplot_index=(0,))
display.time_height_scatter('rh', subplot_index=(1,), cvd_friendly=True, day_night_background=True)
plt.tight_layout()
ds.close()

plt.show()
Total running time of the script: (0 minutes 0.526 seconds)