Note
Go to the end to download the full example code.
Plotting QC Flags#
Simple example for cleaning up a dataset and plotting the data and its QC flags
Author: Adam Theisen
from arm_test_data import DATASETS
from matplotlib import pyplot as plt
import act
# Read in sample MET data
filename_met = DATASETS.fetch('sgpmetE13.b1.20190101.000000.cdf')
ds = act.io.arm.read_arm_netcdf(filename_met)
# In order to utilize all the ACT QC modules and plot the QC,
# we need to clean up the dataset to follow CF standards
ds.clean.cleanup()
# Plot data
# Creat Plot Display
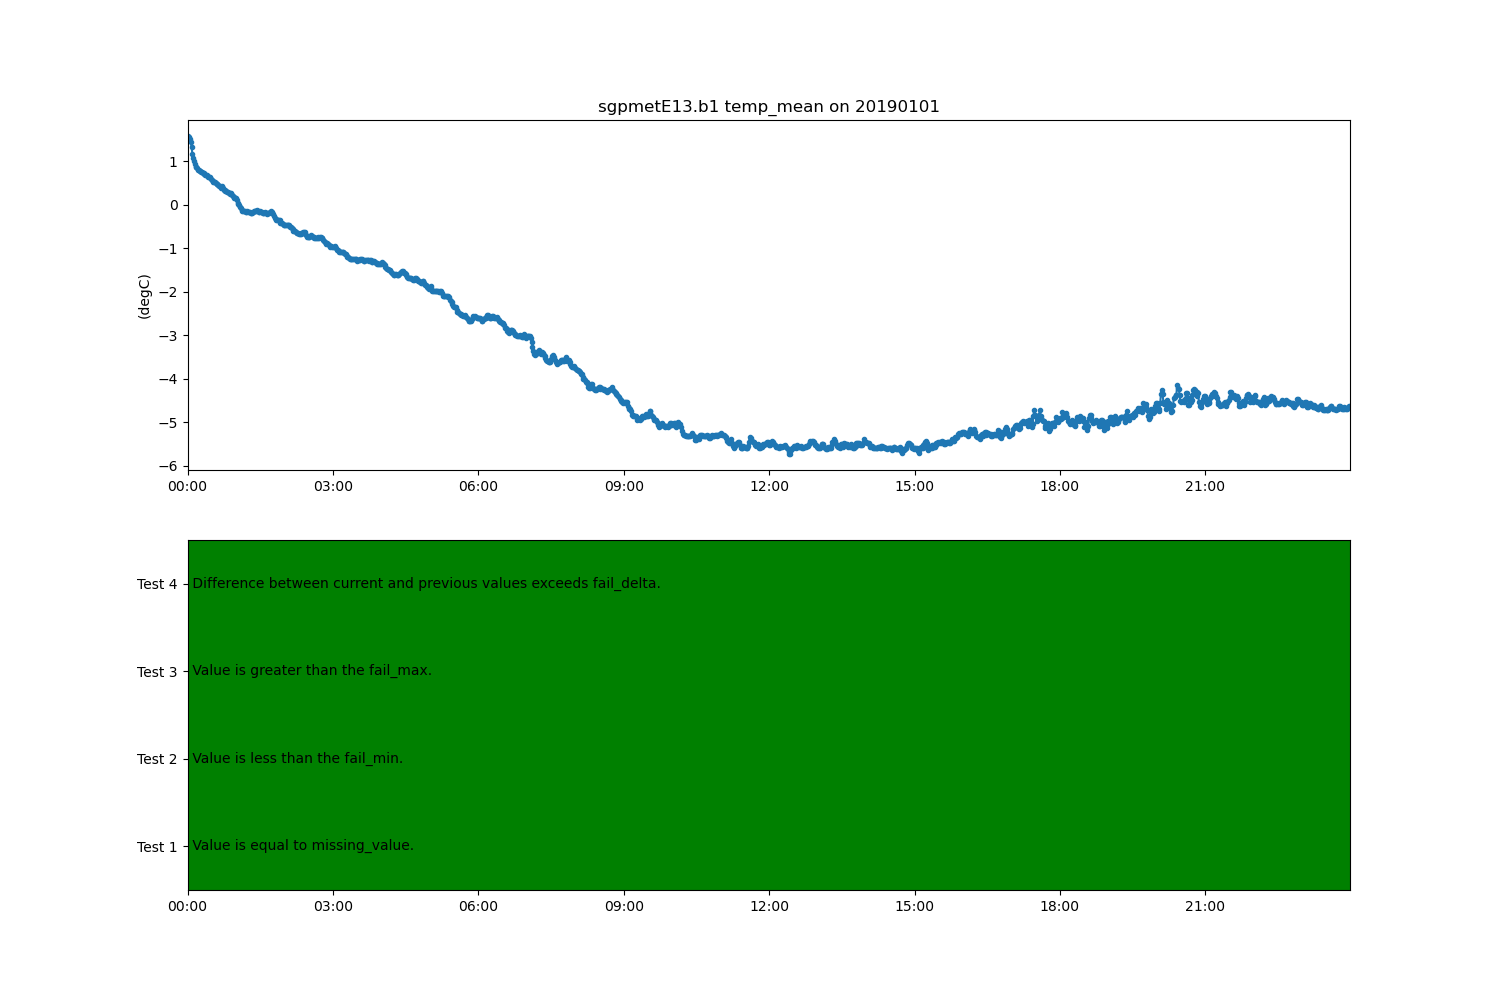
variable = 'temp_mean'
display = act.plotting.TimeSeriesDisplay(ds, figsize=(15, 10), subplot_shape=(2,))
# Plot temperature data in top plot
display.plot(variable, subplot_index=(0,))
# Plot QC data
display.qc_flag_block_plot(variable, subplot_index=(1,))
plt.show()
Total running time of the script: (0 minutes 0.808 seconds)