Note
Go to the end to download the full example code.
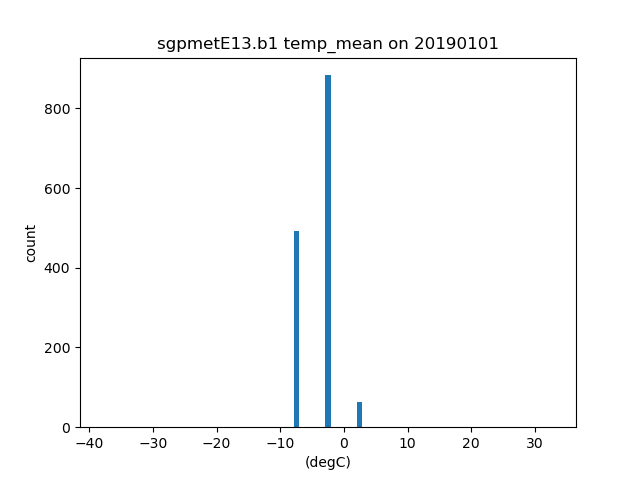
Plot a histogram of Met data.#
This is a simple example for how to plot a histogram of Meteorological data, while using hist_kwargs parameter.
Author: Zachary Sherman
import numpy as np
from arm_test_data import DATASETS
from matplotlib import pyplot as plt

import act

filename_met = DATASETS.fetch('sgpmetE13.b1.20190101.000000.cdf')
met_ds = act.io.arm.read_arm_netcdf(filename_met)

# Plot data
hist_kwargs = {'range': (-10, 10)}
histdisplay = act.plotting.DistributionDisplay(met_ds)
histdisplay.plot_stacked_bar('temp_mean', bins=np.arange(-40, 40, 5), hist_kwargs=hist_kwargs)
plt.show()
Total running time of the script: (0 minutes 0.093 seconds)