Note
Go to the end to download the full example code.
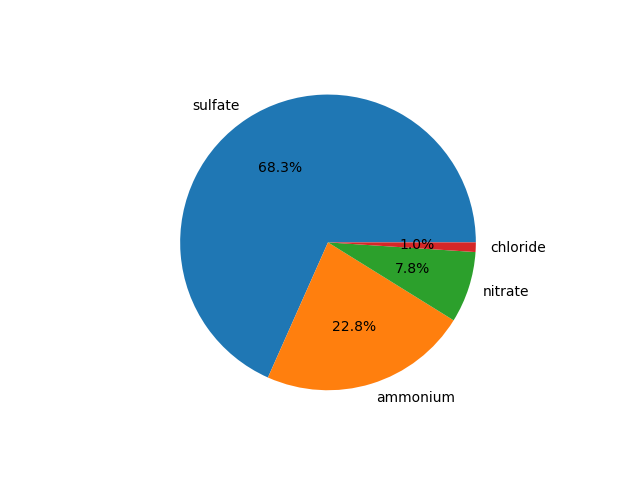
Calculate and plot aerosol percentages.#
Example on how to plot a Pie Chart of the composition of aerosols in a volume of air by obtaining percentages of each aerosol from the dataset.
Author: Zach Sherman
import matplotlib.pyplot as plt
from arm_test_data import DATASETS

import act

# Read in the data.
ds = act.io.read_arm_netcdf(DATASETS.fetch("sgpaosacsmE13.b2.20230420.000109.nc"))

# Calculate percentages using selected fields.
fields = ['sulfate', 'ammonium', 'nitrate', 'chloride']
time_slice = ('2023-04-20T17:38:20.000000000', '2023-04-20T20:29:47.000000000')
threshold = 0.0
percentages = act.utils.calculate_percentages(ds, fields, time_slice=time_slice, threshold=0.0)

# Get values for the pie chart.
labels = percentages.keys()
sizes = [percentages[i] for i in percentages.keys()]

# Plot the figure
fig, ax = plt.subplots()
ax.pie(sizes, labels=labels, autopct='%1.1f%%')
plt.show()
ds.close()
Total running time of the script: (0 minutes 0.069 seconds)