Note
Go to the end to download the full example code.
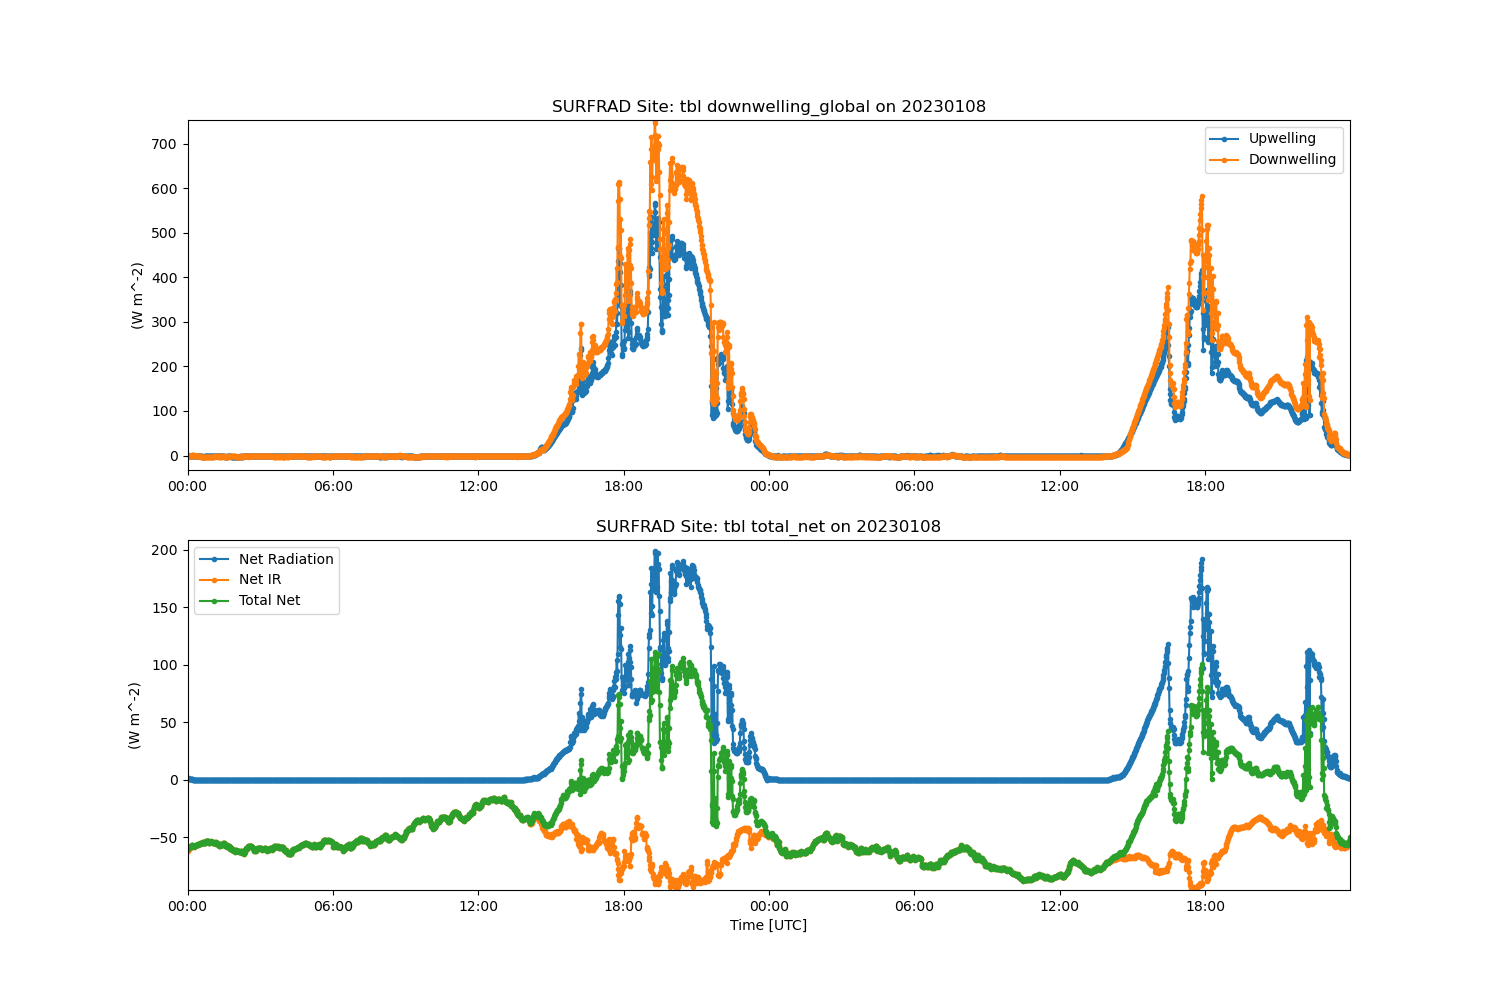
Plot SurfRad Data#
This data shows how to read in SurfRad data from the urls and plot the data up in a time series
Author: Adam Theisen
Downloading tbl23152.dat
Downloading tbl23153.dat
['/home/runner/work/ACT/ACT/examples/io/Boulder_CO_surfrad/tbl23152.dat', '/home/runner/work/ACT/ACT/examples/io/Boulder_CO_surfrad/tbl23153.dat']
import matplotlib.pyplot as plt

import act

# Easily download data from SURFRAD
results = act.discovery.download_surfrad_data('tbl', startdate='20230601', enddate='20230602')
print(results)

# But it's easy enough to read form the URLs as well
url = [
    'https://gml.noaa.gov/aftp/data/radiation/surfrad/Boulder_CO/2023/tbl23008.dat',
    'https://gml.noaa.gov/aftp/data/radiation/surfrad/Boulder_CO/2023/tbl23009.dat',
]
ds = act.io.read_surfrad(url)

# Create an ACT TimeSeriesDisplay.
display = act.plotting.TimeSeriesDisplay(ds, subplot_shape=(2,), figsize=(15, 10))

# Plot different variables from the SURFRAD data
display.plot('upwelling_global', subplot_index=(0,), label='Upwelling')
display.plot('downwelling_global', subplot_index=(0,), label='Downwelling')
plt.legend()

display.plot('net_radiation', subplot_index=(1,), label='Net Radiation')
display.plot('net_ir', subplot_index=(1,), label='Net IR')
display.plot('total_net', subplot_index=(1,), label='Total Net')
plt.legend()

plt.show()
Total running time of the script: (0 minutes 1.269 seconds)