Note
Go to the end to download the full example code.
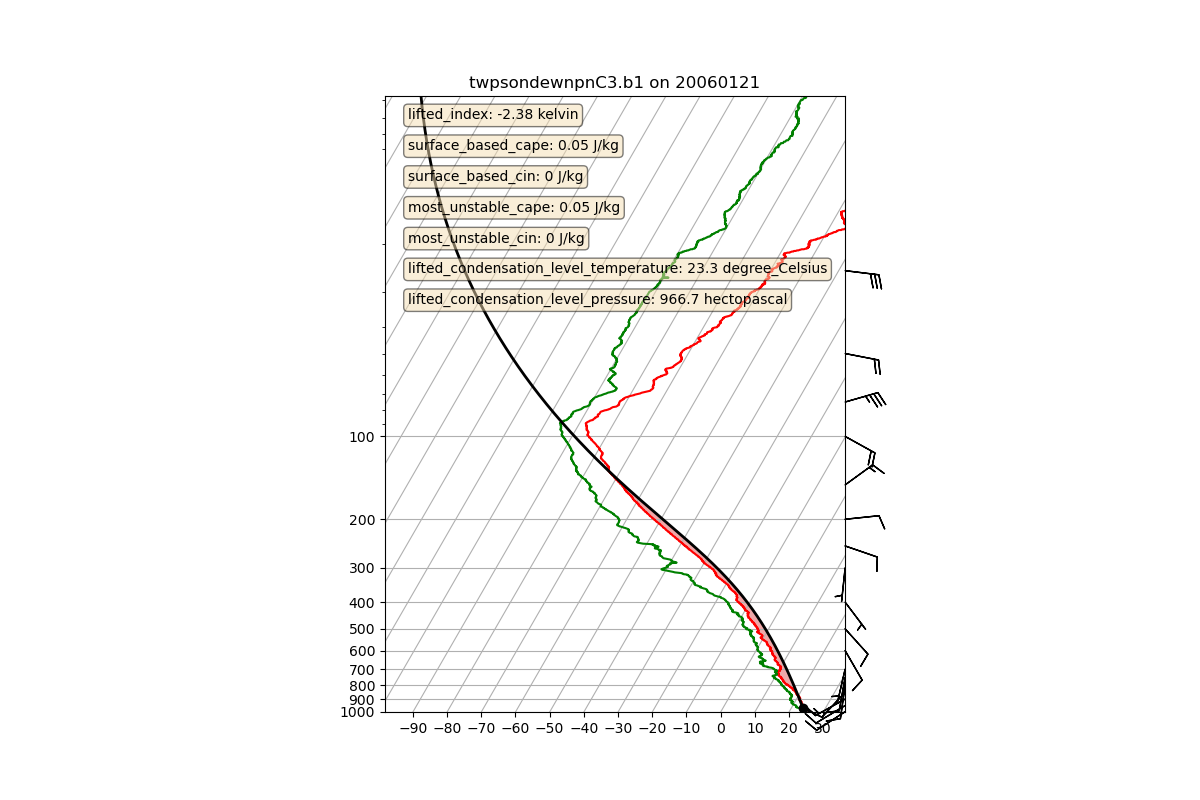
Skew-T plot of a sounding#
This example shows how to make a Skew-T plot from a sounding and calculate stability indicies.
Author: Maxwell Grover
import numpy as np
import xarray as xr
from arm_test_data import DATASETS
from matplotlib import pyplot as plt

import act

# Make sure attributes are retained
xr.set_options(keep_attrs=True)

# Read data
filename_sonde = DATASETS.fetch('twpsondewnpnC3.b1.20060121.231600.custom.cdf')
sonde_ds = act.io.arm.read_arm_netcdf(filename_sonde)


# Calculate stability indicies
sonde_ds = act.retrievals.calculate_stability_indicies(
    sonde_ds, temp_name='tdry', td_name='dp', p_name='pres'
)

# Plot the stability index values on the plot
variables = [
    'lifted_index',
    'surface_based_cape',
    'surface_based_cin',
    'most_unstable_cape',
    'most_unstable_cin',
    'lifted_condensation_level_temperature',
    'lifted_condensation_level_pressure',
]


# Add a helper function which will format the text
def format_variable(variable, rounding_digits=2):
    """Format a sounding variable to displayed on a single line"""
    return f'{variable}: {np.round(sonde_ds[variable], rounding_digits).values} {sonde_ds[variable].units}'


# Setup the plot
skewt = act.plotting.SkewTDisplay(sonde_ds, figsize=(12, 8))

# Add the stability indices
ax = skewt.axes[0]
props = dict(boxstyle='round', facecolor='wheat', alpha=0.5)
for i in range(len(variables)):
    ax.text(
        0.05,
        (0.98 - (0.05 * i)),
        format_variable(variables[i]),
        transform=ax.transAxes,
        fontsize=10,
        verticalalignment='top',
        bbox=props,
    )

# Add data
skewt.plot_from_u_and_v('u_wind', 'v_wind', 'pres', 'tdry', 'dp', shade_cin=False)

sonde_ds.close()
plt.show()
Total running time of the script: (0 minutes 0.323 seconds)