Note
Go to the end to download the full example code.
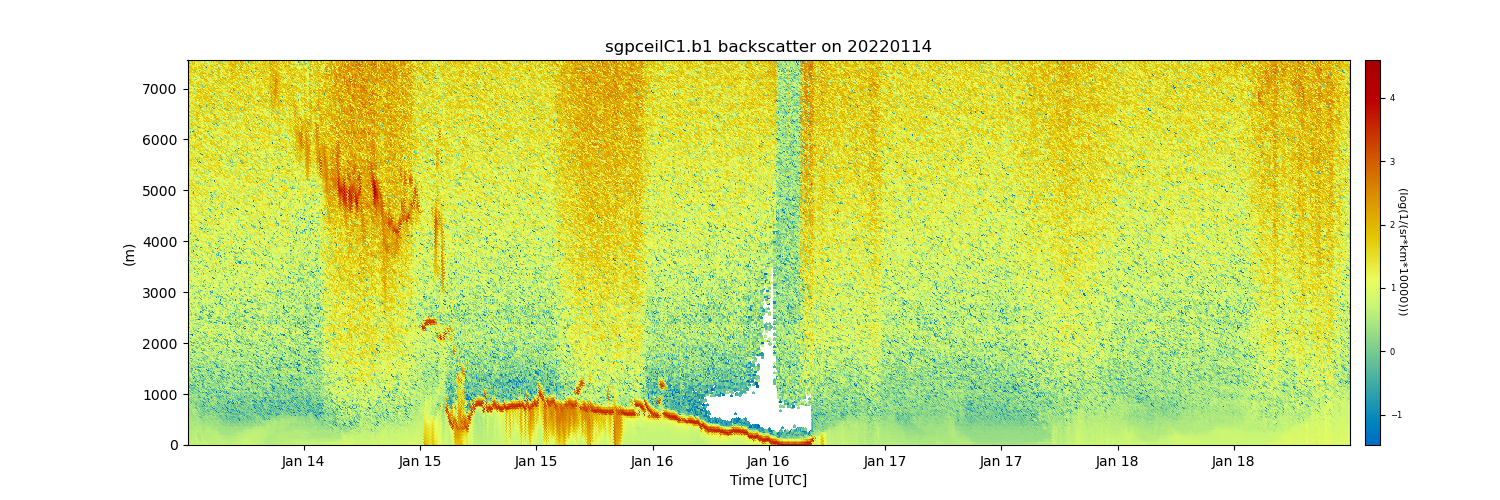
Simple plot of 2D data#
This is an example of how to download and plot ceiliometer data from the SGP site over Oklahoma.
[DOWNLOADING] sgpceilC1.b1.20220114.000001.nc
[DOWNLOADING] sgpceilC1.b1.20220115.000015.nc
[DOWNLOADING] sgpceilC1.b1.20220116.000013.nc
[DOWNLOADING] sgpceilC1.b1.20220117.000010.nc
[DOWNLOADING] sgpceilC1.b1.20220118.000008.nc

If you use these data to prepare a publication, please cite:

Zhang, D., Ermold, B., & Morris, V. Ceilometer (CEIL), 2022-01-14 to 2022-01-19,
Southern Great Plains (SGP), Central Facility, Lamont, OK (C1). Atmospheric
Radiation Measurement (ARM) User Facility. https://doi.org/10.5439/1181954
import os

import matplotlib.pyplot as plt
from arm_test_data import DATASETS

import act

# Place your username and token here
username = os.getenv('ARM_USERNAME')
token = os.getenv('ARM_PASSWORD')

# If the username and token are not set, use the existing sample file
if username is None or token is None or len(username) == 0 or len(token) == 0:
    filename_ceil = DATASETS.fetch('sgpceilC1.b1.20190101.000000.nc')
    ceil_ds = act.io.arm.read_arm_netcdf(filename_ceil, engine='netcdf4')
else:
    # Example to show how easy it is to download ARM data if a username/token are set
    results = act.discovery.download_arm_data(
        username, token, 'sgpceilC1.b1', '2022-01-14', '2022-01-19'
    )
    ceil_ds = act.io.arm.read_arm_netcdf(results)

# Adjust ceilometer data for plotting
ceil_ds = act.corrections.ceil.correct_ceil(ceil_ds, -9999.0)

# Plot up ceilometer backscatter using HomeyerRainbow CVD friendly colormap
# The same could be done with keyword 'cmap='HomeyerRainbow'
display = act.plotting.TimeSeriesDisplay(ceil_ds, subplot_shape=(1,), figsize=(15, 5))
display.plot('backscatter', subplot_index=(0,), cvd_friendly=True)
plt.show()
Total running time of the script: (0 minutes 12.703 seconds)