Ctrl+K

ACT Documentation

  • ACT Version 2 Release Guide
  • User Guide
  • API Reference Manual
  • ACT Example Gallery
  • Blog
    • GitHub Issue Tracker
  • GitHub
  • ACT Version 2 Release Guide
  • User Guide
  • API Reference Manual
  • ACT Example Gallery
  • Blog
  • GitHub Issue Tracker
  • GitHub

Section Navigation

  • Correction examples
    • Correct wind data for ship motion
  • Discovery examples
    • NASA MPLNET
    • Query and plot ASOS data
    • IMPROVE Data
    • NOAA FMCW and parsivel plot
    • NEON Data
    • Airnow Data
  • Input/Output Examples
    • Read and plot a HYSPLIT trajectory file from a HYSPlIT run.
    • Read and plot a PPI from raw mini-MPL data
    • Read and plot a Sodar file
    • Plot SurfRad Data
    • Plot ICARTT Formatted Files
    • Create a dataset to mimic ARM file formats
    • Convert Data to AmeriFlux Format
  • Plotting examples
    • Enhanced plot of a sounding
    • Plot a histogram of Met data.
    • Plot a timeseries of sounding data
    • Time-Height Scatter Plot
    • Plot ARM AAF Flight Path
    • Plotting QC Flags
    • Example plot using stripes
    • Example Size Distribution Plots
    • Investigate Temperature Quantiles
    • Calculate and plot daily daytime temperature averages
    • Skew-T plot of a sounding
    • Plot a timeseries of sounding data
    • Calculate and plot wind rose plots separated by day.
    • Secondary Y-Axis Plotting
    • Calculate and View Aerosol Percentages
    • Xarray Plotting Examples
    • Multidimensional cross sections
    • Simple plot of 2D data
    • Example plot using heat maps
    • Using ACT for Satellite data
    • Skew-T plot of a sounding
    • Spatial contour plot
    • Compare Aircraft Airspeeds
    • Plot winds and relative humidity from sounding data
    • Data rose plot
    • Windrose and windbarb timeseries plot
    • Plot Present Weather Code
    • Plotting state variables
    • Working with netCDF groups
  • Quality Control Examples
    • Query the ARM DQR webservice
    • Query the ARM DQR webservice
    • Forcing line plots with 2D data and QC
    • Plotting flagged data gaps with a step change test
    • Plotting Baseline Surface Radiation Network (BSRN) QC Flags
    • Working with embedded quality control variables
    • Working with and expanding embedded quality control variables
  • Retrieval examples
    • Retrieve stability indicies from a sounding
    • Cloud Base Height Retrievals
  • Utility examples
    • Calculate and plot aerosol percentages.
    • Parse the ARM datastream filename
    • Changing units in dataset
    • Working with TAR and gunzip files
  • Workflow examples
    • Transformations and QC
    • Plot multiple datasets
    • Plot AERIoe data with cloud base height from ceilometer
    • Calculate and plot weighted means
    • Merge multiple datasets
    • Consolidation of CoURAGE Data Sources
    • Consolidation of Data Sources
  • ACT Example Gallery
  • Utility examples

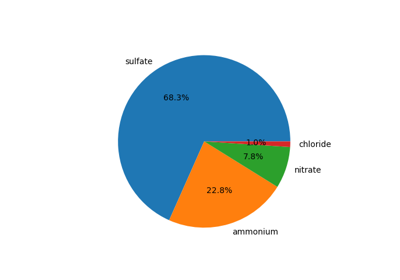
Utility examples#

Examples showing different helpful utilies in ACT.

Calculate and plot aerosol percentages.

Calculate and plot aerosol percentages.

Parse the ARM datastream filename

Parse the ARM datastream filename

Changing units in dataset

Changing units in dataset

Working with TAR and gunzip files

Working with TAR and gunzip files

previous

Cloud Base Height Retrievals

next

Calculate and plot aerosol percentages.

This Page

  • Show Source

© Copyright 2018-2024, ACT Developers.

Created using Sphinx 7.1.2.

Built with the PyData Sphinx Theme 0.16.1.