Note
Go to the end to download the full example code.
Transformations and QC#
Built-in transformations using xarray are not quality-control aware. This example shows how a user should apply QC prior to performing transformations.
With no QC applied before transformation
Before (10 1-minute samples): [0 0 0 0 0 0 0 2 0 0]
After: (2 5-minute averages) [0.26666667 0.93333333]
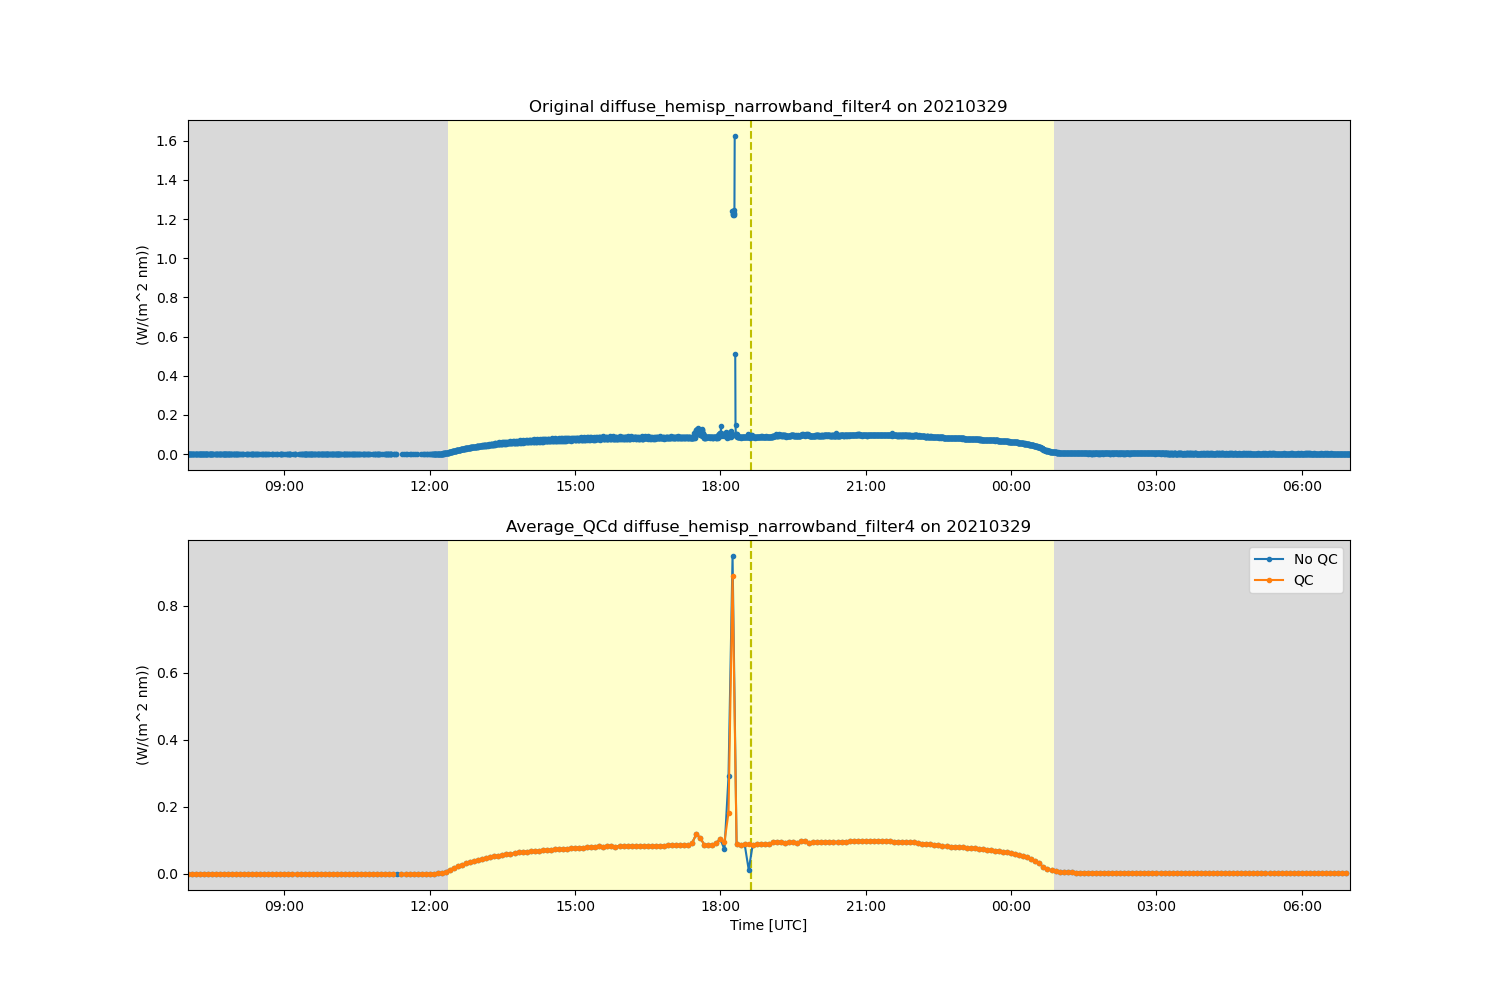
Average of diffuse_hemisp_narrowband_filter4 before and after applying QC
Note the change in the second value
Before (2 5 - minute averages): [0.00013936 0.00013936]
After: (2 5 - minute averages) [0.00013936 0.0001885 ]
import matplotlib.pyplot as plt
from arm_test_data import DATASETS

import act

# Read in some sample MFRSR data and clean up the QC
filename_mfrsr = DATASETS.fetch('sgpmfrsr7nchE11.b1.20210329.070000.nc')
ds = act.io.arm.read_arm_netcdf(filename_mfrsr, cleanup_qc=True)

# Let's resample the data to 5 minutes and take the mean
ds_5min = ds.resample(time='5min').mean()

variable = 'diffuse_hemisp_narrowband_filter4'

# Let's look at a before and after of one of the qc variables
print('With no QC applied before transformation')
print('Before (10 1-minute samples): ', ds['qc_' + variable].values[0:10])
print('After: (2 5-minute averages)', ds_5min['qc_' + variable].values[0:2])

# That new QC variable does not make sense at all and should be an int
# What needs to happen is that we apply QC as the user see's fit to all
# variables before the transformations take place.
print('\nAverage of ', variable, ' before and after applying QC')
print('Note the change in the second value')
print('Before (2 5 - minute averages): ', ds[variable].values[0:2])

ds.qcfilter.datafilter(rm_assessments=['Bad', 'Indeterminate'])
ds_5minb = ds.resample(time='5min').mean()

# Print out the corresponding variable values
print('After: (2 5 - minute averages)', ds_5minb[variable].values[0:2])

## Plot up the variable and qc block plot
display = act.plotting.TimeSeriesDisplay(
    {'Original': ds, 'Average': ds_5min, 'Average_QCd': ds_5minb},
    figsize=(15, 10),
    subplot_shape=(2,),
)
display.plot(variable, dsname='Original', subplot_index=(0,), day_night_background=True)
display.plot(
    variable, dsname='Average', subplot_index=(1,), day_night_background=True, label='No QC'
)
display.plot(
    variable, dsname='Average_QCd', subplot_index=(1,), day_night_background=True, label='QC'
)
plt.legend()
plt.show()
Total running time of the script: (1 minutes 32.410 seconds)