Note
Go to the end to download the full example code.
Merge multiple datasets#
Example to merge multiple data products into one using ACT. Shows how to adjust the timestamp if the timestamps are at different part of the sample interval (left, right, center). Also shows how to apply QC information, merge and resample data using xarray and plot/write out the results.
import matplotlib.pyplot as plt
import xarray as xr
from arm_test_data import DATASETS
import act
# Set data files
# An alternative to this is to download data from the
# ARM Data Webservice as shown in the discovery plot_neon.py example
ebbr_file = DATASETS.fetch('sgp30ebbrE13.b1.20190601.000000.nc')
ecor_file = DATASETS.fetch('sgp30ecorE14.b1.20190601.000000.cdf')
sebs_file = DATASETS.fetch('sgpsebsE14.b1.20190601.000000.cdf')
# Read data into datasets
ds_ebbr = act.io.arm.read_arm_netcdf(ebbr_file, use_base_time=True)
ds_ecor = act.io.arm.read_arm_netcdf(ecor_file, use_base_time=True)
ds_sebs = act.io.arm.read_arm_netcdf(sebs_file, use_base_time=True)
# Check for ARM DQRs and add them to the QC variables
ds_ebbr = act.qc.arm.add_dqr_to_qc(ds_ebbr)
ds_ecor = act.qc.arm.add_dqr_to_qc(ds_ecor)
ds_sebs = act.qc.arm.add_dqr_to_qc(ds_sebs)
# The ECOR and EBBR have different definitions of latent heat
# flux and what is positive vs negative. Check out the ARM
# Handbooks for more information
ds_ecor['lv_e'].values = ds_ecor['lv_e'].values * -1.0
# For example purposes, let's rename the ecor latent heat flux
ds_ecor = ds_ecor.rename({'lv_e': 'latent_heat_flux_ecor'})
ds_ecor['latent_heat_flux_ecor'].attrs['ancillary_variables'] = 'qc_latent_heat_flux_ecor'
ds_ecor = ds_ecor.rename({'qc_lv_e': 'qc_latent_heat_flux_ecor'})
# Also going to Switch some QC for example purposes
qc = ds_ecor['qc_latent_heat_flux_ecor'].values
qc[10:20] = 2
ds_ecor['qc_latent_heat_flux_ecor'].values = qc
# There is a difference in how these timestamps are defined
# The EBBR is at the end of the sampling interval and the
# ECOR is at the beginning. Knowing this, we can shift the
# EBBR timestampes by 30 minutes to coincide with the ECOR
ds_ebbr = act.utils.datetime_utils.adjust_timestamp(ds_ebbr, offset=-30 * 60)
# Now, we can merge all these datasets into one product
ds = xr.merge([ds_ecor, ds_ebbr, ds_sebs], compat='override')
# Apply the QC information to set all flagged data to missing/NaN
ds.qcfilter.datafilter(
del_qc_var=False, rm_assessments=['Bad', 'Incorrect', 'Indeterminate', 'Suspect']
)
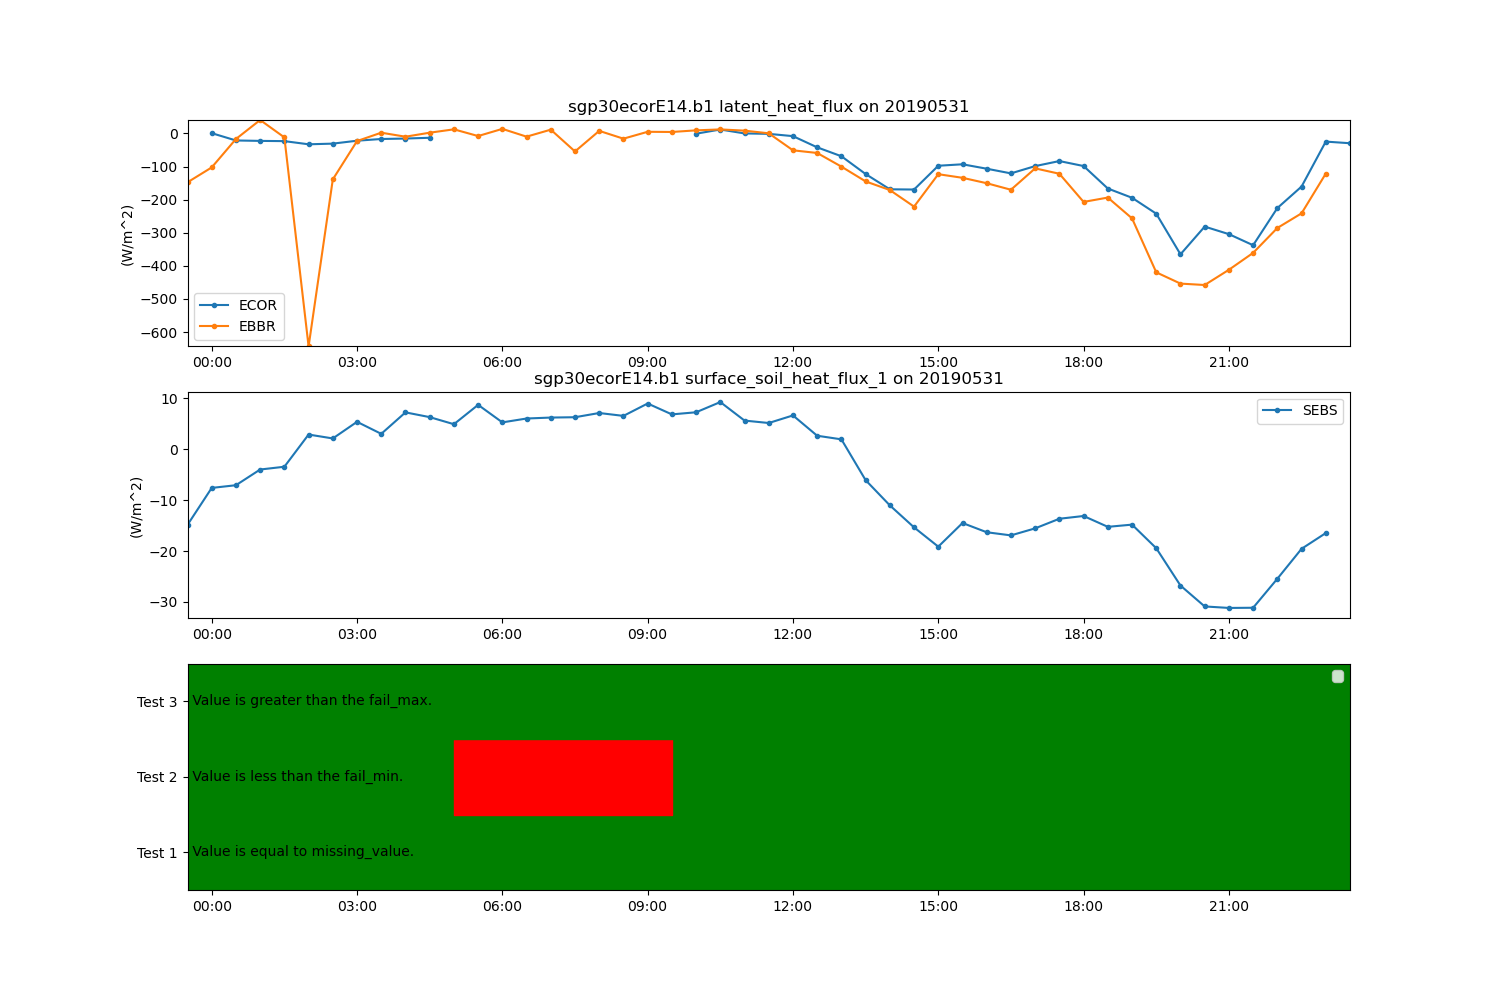
# Plot up data from the merged dataset for each of the instruments
display = act.plotting.TimeSeriesDisplay(ds, figsize=(15, 10), subplot_shape=(3,))
display.plot('latent_heat_flux_ecor', label='ECOR', subplot_index=(0,))
display.plot('latent_heat_flux', label='EBBR', subplot_index=(0,))
plt.legend()
display.plot('surface_soil_heat_flux_1', label='SEBS', subplot_index=(1,))
# Plot out the QC information that was modified as well
display.qc_flag_block_plot('latent_heat_flux_ecor', subplot_index=(2,))
plt.show()
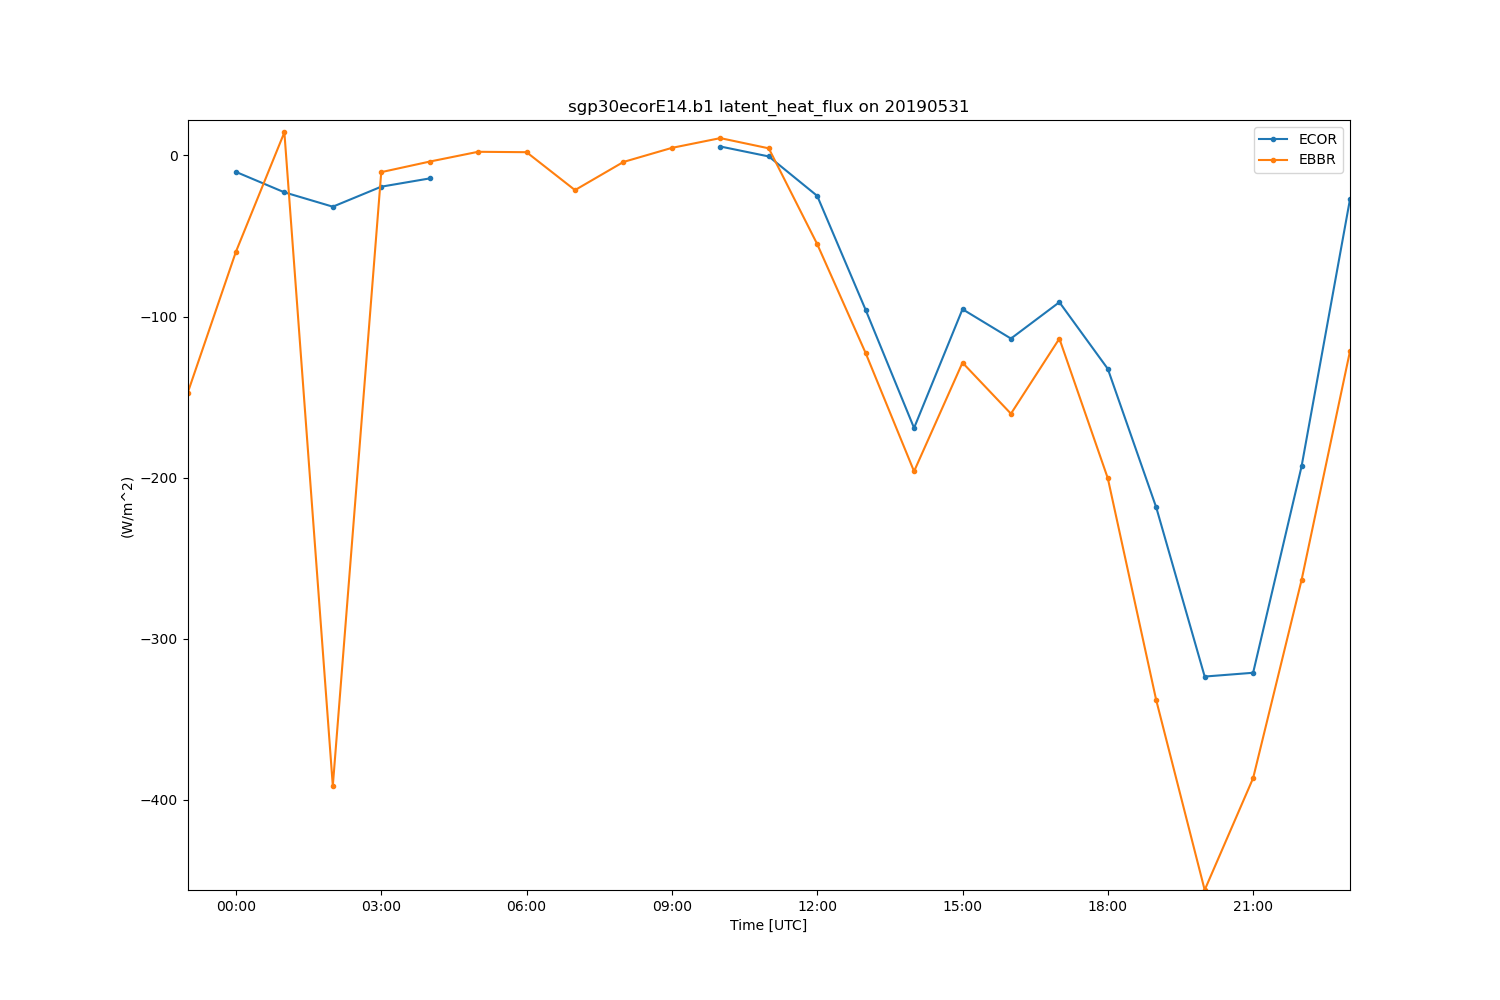
# Resample the data to 1 hour mean
# Check out the xarray documentation for more information
# on the resample function. Options include mean, median,
# max, min, sum, nearest, and more.
ds = ds.resample(time='h').mean(keep_attrs=True)
# Plot up data from the hourly merged dataset for ECOR and EBBR
display = act.plotting.TimeSeriesDisplay(ds, figsize=(15, 10), subplot_shape=(1,))
display.plot('latent_heat_flux_ecor', label='ECOR', subplot_index=(0,))
display.plot('latent_heat_flux', label='EBBR', subplot_index=(0,))
plt.show()
# Write data out to netcdf
ds.to_netcdf('./sgpecor_ebbr_sebs.nc')
Total running time of the script: (0 minutes 17.388 seconds)