Note
Go to the end to download the full example code.
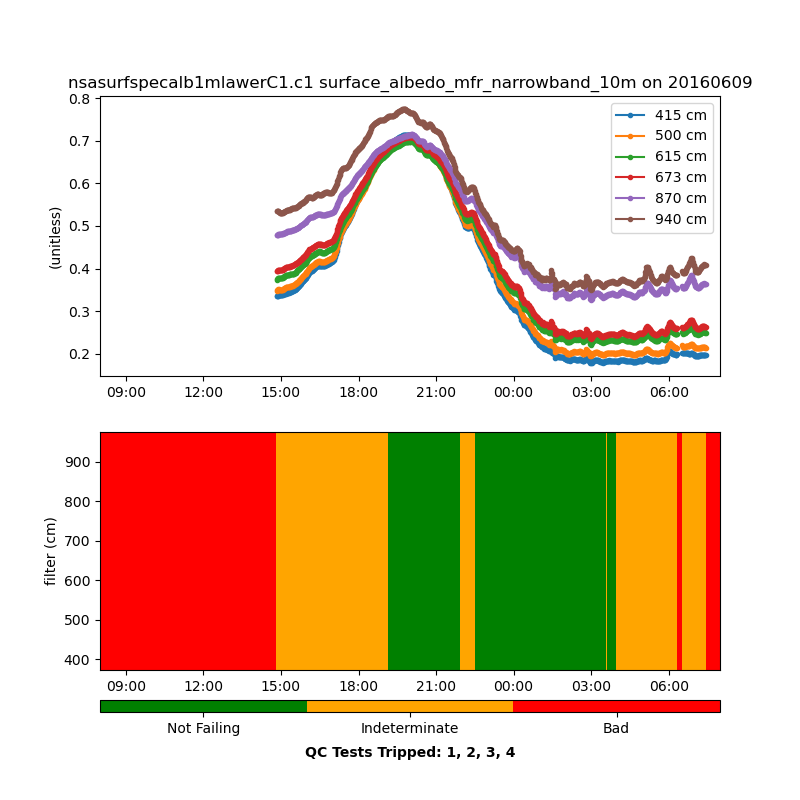
Forcing line plots with 2D data and QC#
This is an example of how to use 2 dimentional DataArrays containing multiple 1 dimentional data, including a summary quality control plot showing the tests for each 1 dimentional data slice. This example uses the force_line_plot keyword which will force multiple 1 dimentional plots for each element along the second dimention of the non-time dimention.
Author: Ken Kehoe
import matplotlib.pyplot as plt
from arm_test_data import DATASETS

from act.io.arm import read_arm_netcdf
from act.plotting import TimeSeriesDisplay

# Read a data file that has a 2D DataArray of multiple 1D data.
# The corresponding quality control DataArray is also read in and
# will be used to make a summary plot of quality control infomation
# of each assessment category.
filename_surf = DATASETS.fetch('nsasurfspecalb1mlawerC1.c1.20160609.080000.nc')
ds = read_arm_netcdf(filename_surf)

# The name of the data variable we wish to plot
var_name = 'surface_albedo_mfr_narrowband_10m'

# Create the ACT display object used for plotting. This will have two
# vertical plots of 800 by 400 pixels.
display = TimeSeriesDisplay(ds, subplot_shape=(2,), figsize=(8, 2 * 4))

# Create the top plot of data using the force_line_plot option.
# This will force the plotting to not assume the data are 2D data that
# would normally be plotted as a 2D plot. Rather for each index into the
# filter dimention plot a 1D time series plot. Setting labels=True
# will create a legend using the filter dimention DataArray.
display.plot(var_name, force_line_plot=True, labels=True)

# Create the bottom plot of summarized quality control by assessment
# cateory.
display.qc_flag_block_plot(var_name, subplot_index=(1,))

# Show the plot in a new window.
plt.show()
Total running time of the script: (0 minutes 0.180 seconds)