Note
Go to the end to download the full example code.
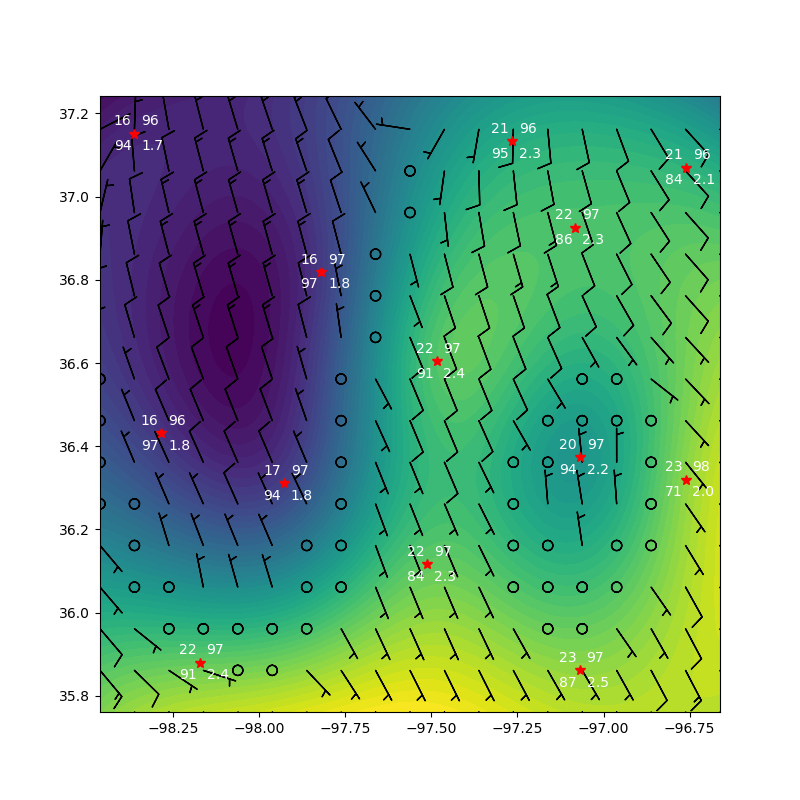
Spatial contour plot#
This is an example of how to prepare and plot data for a contour plot
Author: Adam Theisen
import matplotlib.pyplot as plt
from arm_test_data import DATASETS

import act

met_contour_list = [
    'sgpmetE15.b1.20190508.000000.cdf',
    'sgpmetE31.b1.20190508.000000.cdf',
    'sgpmetE32.b1.20190508.000000.cdf',
    'sgpmetE33.b1.20190508.000000.cdf',
    'sgpmetE34.b1.20190508.000000.cdf',
    'sgpmetE35.b1.20190508.000000.cdf',
    'sgpmetE36.b1.20190508.000000.cdf',
    'sgpmetE37.b1.20190508.000000.cdf',
    'sgpmetE38.b1.20190508.000000.cdf',
    'sgpmetE39.b1.20190508.000000.cdf',
    'sgpmetE40.b1.20190508.000000.cdf',
    'sgpmetE9.b1.20190508.000000.cdf',
    'sgpmetE13.b1.20190508.000000.cdf',
]

met_contour_filenames = [DATASETS.fetch(file) for file in met_contour_list]

time = '2019-05-08T04:00:00.000000000'
data = {}
fields = {}
wind_fields = {}
station_fields = {}
for f in met_contour_filenames:
    ds = act.io.arm.read_arm_netcdf(f)
    data.update({f: ds})
    fields.update({f: ['lon', 'lat', 'temp_mean']})
    wind_fields.update({f: ['lon', 'lat', 'wspd_vec_mean', 'wdir_vec_mean']})
    station_fields.update(
        {
            f: [
                'lon',
                'lat',
                'temp_mean',
                'atmos_pressure',
                'vapor_pressure_mean',
                'rh_mean',
            ]
        }
    )

display = act.plotting.ContourDisplay(data, figsize=(8, 8))
display.create_contour(fields=fields, time=time, levels=50)
display.plot_vectors_from_spd_dir(fields=wind_fields, time=time, mesh=True, grid_delta=(0.1, 0.1))
display.plot_station(fields=station_fields, time=time, markersize=7, color='red')
plt.show()
Total running time of the script: (0 minutes 1.036 seconds)