Note
Go to the end to download the full example code.
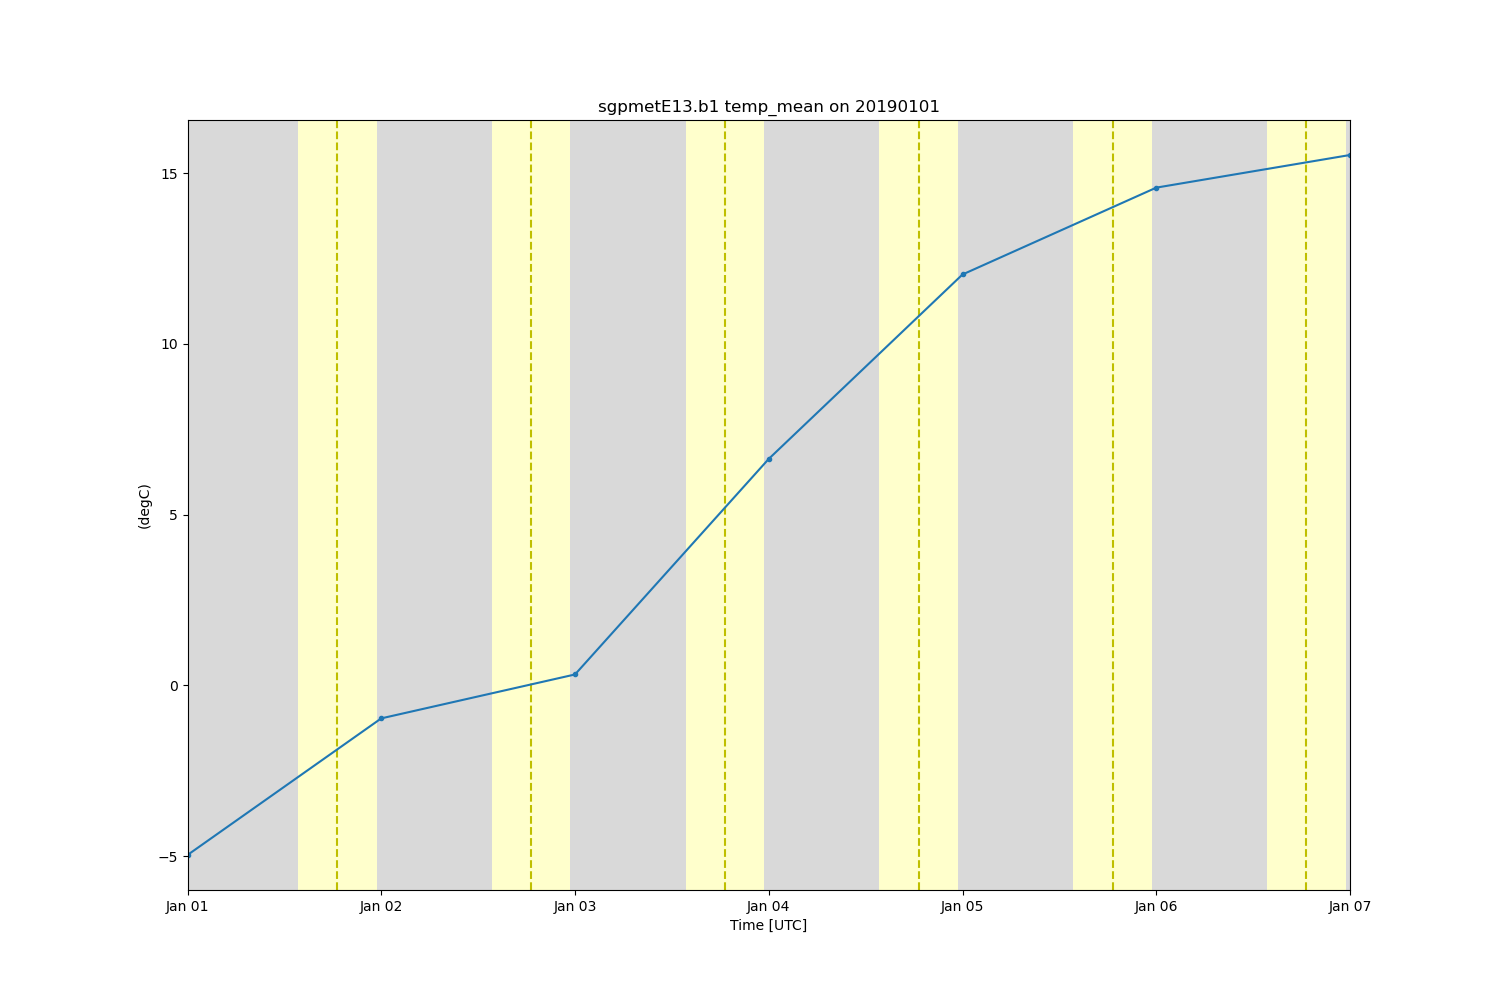
Calculate and plot daily daytime temperature averages#
Example of how to read in MET data and plot up daytime temperature averages using the add_solar_variable function
Author: Adam Theisen
import matplotlib.pyplot as plt
from arm_test_data import DATASETS

import act

# Read in the sample MET data
met_wildcard_list = [
    'sgpmetE13.b1.20190101.000000.cdf',
    'sgpmetE13.b1.20190102.000000.cdf',
    'sgpmetE13.b1.20190103.000000.cdf',
    'sgpmetE13.b1.20190104.000000.cdf',
    'sgpmetE13.b1.20190105.000000.cdf',
    'sgpmetE13.b1.20190106.000000.cdf',
    'sgpmetE13.b1.20190107.000000.cdf',
]
met_filenames = [DATASETS.fetch(file) for file in met_wildcard_list]
ds = act.io.arm.read_arm_netcdf(met_filenames)

# Add the solar variable, including dawn/dusk to variable
ds = act.utils.geo_utils.add_solar_variable(ds)

# Using the sun variable, only analyze daytime data
ds = ds.where(ds['sun_variable'] == 1)

# Take daily mean using xarray features
ds = ds.resample(time='1d', skipna=True).mean()

# Creat Plot Display
display = act.plotting.TimeSeriesDisplay(ds, figsize=(15, 10))
display.plot('temp_mean', linestyle='solid')
display.day_night_background()
plt.show()

ds.close()
Total running time of the script: (0 minutes 1.054 seconds)